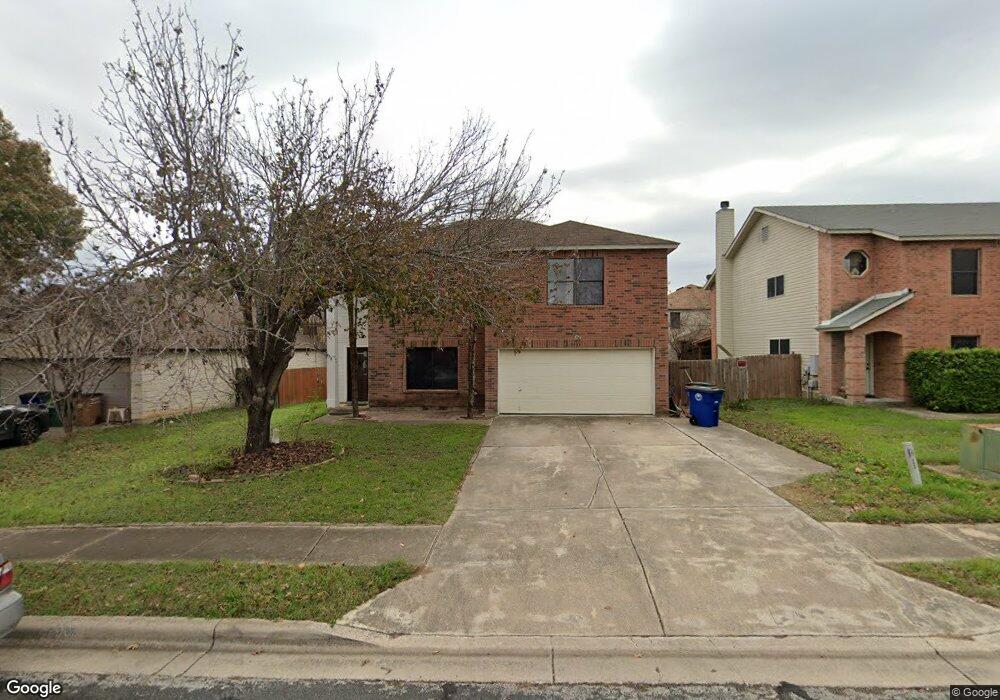
7907 Rosenberry Dr Unit C (Next to stairs) Austin, TX 78747
Bluff Springs NeighborhoodEstimated Value: $321,361 - $372,000
1
Bed
1
Bath
100
Sq Ft
$3,446/Sq Ft
Est. Value
About This Home
This home is located at 7907 Rosenberry Dr Unit C (Next to stairs), Austin, TX 78747 and is currently estimated at $344,590, approximately $3,445 per square foot. 7907 Rosenberry Dr Unit C (Next to stairs) is a home located in Travis County with nearby schools including Palm Elementary School, Paredes Middle School, and Akins High School.
Ownership History
Date
Name
Owned For
Owner Type
Purchase Details
Closed on
Feb 27, 2023
Sold by
English Amy
Bought by
Black Cat Llc Series-B
Current Estimated Value
Purchase Details
Closed on
Nov 9, 2016
Sold by
Paige Rickey D
Bought by
English Amy and Barrera Luis L
Home Financials for this Owner
Home Financials are based on the most recent Mortgage that was taken out on this home.
Original Mortgage
$194,901
Interest Rate
3.62%
Mortgage Type
FHA
Purchase Details
Closed on
Jan 28, 2000
Sold by
Kaufman & Broad Lone Star Lp
Bought by
Paige Rickey D
Home Financials for this Owner
Home Financials are based on the most recent Mortgage that was taken out on this home.
Original Mortgage
$120,655
Interest Rate
8.31%
Mortgage Type
VA
Create a Home Valuation Report for This Property
The Home Valuation Report is an in-depth analysis detailing your home's value as well as a comparison with similar homes in the area
Home Values in the Area
Average Home Value in this Area
Purchase History
| Date | Buyer | Sale Price | Title Company |
|---|---|---|---|
| Black Cat Llc Series-B | -- | -- | |
| English Amy | -- | Independence Title | |
| Paige Rickey D | -- | San Antonio Title Company |
Source: Public Records
Mortgage History
| Date | Status | Borrower | Loan Amount |
|---|---|---|---|
| Previous Owner | English Amy | $194,901 | |
| Previous Owner | Paige Rickey D | $120,655 |
Source: Public Records
Property History
| Date | Event | Price | List to Sale | Price per Sq Ft |
|---|---|---|---|---|
| 10/24/2024 10/24/24 | For Rent | $625 | 0.0% | -- |
| 09/28/2024 09/28/24 | For Rent | $625 | -- | -- |
Tax History Compared to Growth
Tax History
| Year | Tax Paid | Tax Assessment Tax Assessment Total Assessment is a certain percentage of the fair market value that is determined by local assessors to be the total taxable value of land and additions on the property. | Land | Improvement |
|---|---|---|---|---|
| 2025 | $7,019 | $351,515 | $62,722 | $288,793 |
| 2023 | $4,434 | $323,282 | $0 | $0 |
| 2022 | $5,804 | $293,893 | $0 | $0 |
| 2021 | $5,816 | $267,175 | $60,000 | $209,637 |
| 2020 | $5,210 | $242,886 | $60,000 | $182,886 |
| 2018 | $5,093 | $230,047 | $60,000 | $179,032 |
| 2017 | $4,664 | $209,134 | $30,000 | $179,134 |
| 2016 | $4,008 | $179,734 | $30,000 | $149,734 |
| 2015 | $3,049 | $173,627 | $30,000 | $143,627 |
| 2014 | $3,049 | $128,115 | $30,000 | $98,115 |
Source: Public Records
Map
Nearby Homes
- 8007 Bramble Bush Dr
- 6604 Marble Creek Loop
- 6745 Marble Creek Loop
- 7817 Marble Ridge Dr
- 6725 Broad Brook Dr
- 8201 Georgie Trace Ave
- 8008 Verbank Villa Dr
- 6404 Piedras Blanco Dr
- 7541 Redrick Dr
- 7537 Marble Ridge Dr
- 7501 Marble Ridge Dr
- 6632 Doyal Dr
- 7412 Crepe Myrtle Dr
- 6636 Quinton Dr
- 7517 Knockfin Dr
- 7105 Nutria Run
- 6828 Walkup Ln
- 6732 Derby Downs Dr
- 7604 Peccary Dr
- 6913 Derby Downs Dr
- 7907 Rosenberry Dr
- 7905 Rosenberry Dr
- 7909 Rosenberry Dr
- 7906 Bramble Bush Dr
- 7903 Rosenberry Dr
- 7911 Rosenberry Dr
- 7904 Bramble Bush Dr
- 7908 Bramble Bush Dr
- 7906 Rosenberry Dr
- 7902 Bramble Bush Dr
- 7910 Bramble Bush Dr
- 7908 Rosenberry Dr
- 7904 Rosenberry Dr
- 7901 Rosenberry Dr
- 7910 Rosenberry Dr
- 7902 Rosenberry Dr
- 8000 Bramble Bush Dr
- 7900 Bramble Bush Dr
- 8000 Rosenberry Dr
- 8003 Rosenberry Dr