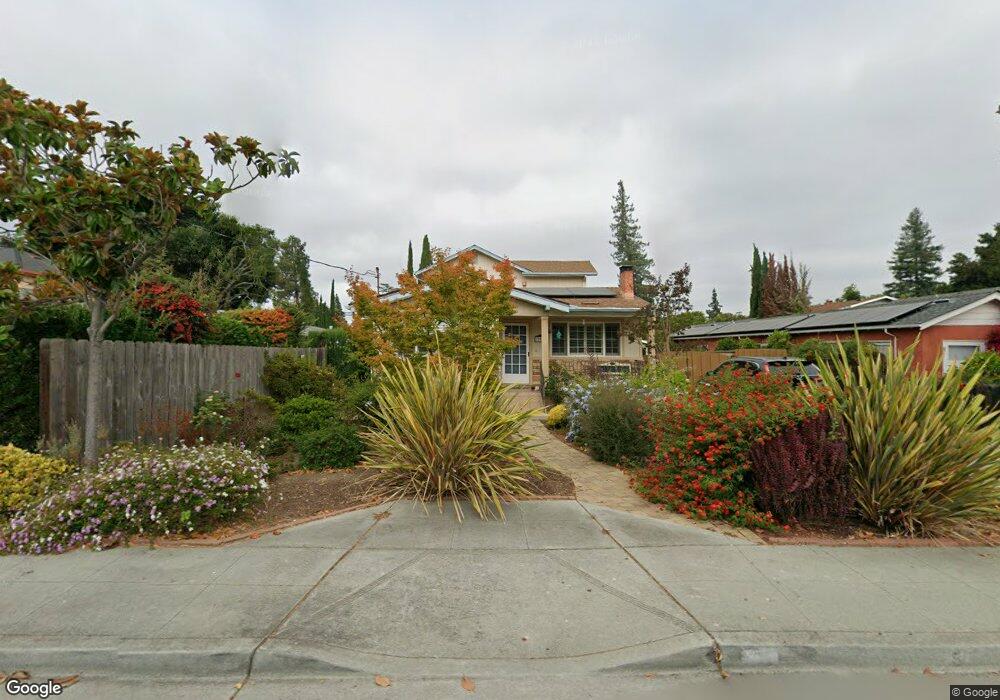
792 Calderon Ave Mountain View, CA 94041
Estimated Value: $2,443,000 - $3,205,786
5
Beds
3
Baths
1,758
Sq Ft
$1,681/Sq Ft
Est. Value
About This Home
This home is located at 792 Calderon Ave, Mountain View, CA 94041 and is currently estimated at $2,955,197, approximately $1,680 per square foot. 792 Calderon Ave is a home located in Santa Clara County with nearby schools including Edith Landels Elementary School, Isaac Newton Graham Middle School, and Mountain View High School.
Ownership History
Date
Name
Owned For
Owner Type
Purchase Details
Closed on
Jun 3, 2021
Sold by
Simoes Maria Fatima
Bought by
Simoes Maria Fatima and Klein Isabel M
Current Estimated Value
Purchase Details
Closed on
May 22, 2021
Sold by
Klein Gregory Paul and Klein Isabel Maria
Bought by
Klein Gregory Paul and Klein Isabel Maria
Purchase Details
Closed on
Jun 3, 1999
Sold by
Simoes Manuel B and Simoes Maria F
Bought by
Klein Gregory P and Klein Isabel M
Home Financials for this Owner
Home Financials are based on the most recent Mortgage that was taken out on this home.
Original Mortgage
$150,000
Interest Rate
6.9%
Create a Home Valuation Report for This Property
The Home Valuation Report is an in-depth analysis detailing your home's value as well as a comparison with similar homes in the area
Home Values in the Area
Average Home Value in this Area
Purchase History
| Date | Buyer | Sale Price | Title Company |
|---|---|---|---|
| Simoes Maria Fatima | -- | None Listed On Document | |
| Klein Gregory Paul | -- | None Available | |
| Klein Gregory P | $190,000 | Financial Title Company |
Source: Public Records
Mortgage History
| Date | Status | Borrower | Loan Amount |
|---|---|---|---|
| Previous Owner | Klein Gregory P | $150,000 |
Source: Public Records
Tax History
| Year | Tax Paid | Tax Assessment Tax Assessment Total Assessment is a certain percentage of the fair market value that is determined by local assessors to be the total taxable value of land and additions on the property. | Land | Improvement |
|---|---|---|---|---|
| 2025 | $3,098 | $244,585 | $31,850 | $212,735 |
| 2024 | $3,098 | $239,790 | $31,226 | $208,564 |
| 2023 | $3,068 | $235,089 | $30,614 | $204,475 |
| 2022 | $3,057 | $230,480 | $30,014 | $200,466 |
| 2021 | $2,903 | $225,962 | $29,426 | $196,536 |
| 2020 | $2,904 | $223,646 | $29,125 | $194,521 |
| 2019 | $2,791 | $219,261 | $28,554 | $190,707 |
| 2018 | $2,772 | $214,963 | $27,995 | $186,968 |
| 2017 | $2,665 | $210,749 | $27,447 | $183,302 |
| 2016 | $2,531 | $206,617 | $26,909 | $179,708 |
| 2015 | $2,461 | $203,514 | $26,505 | $177,009 |
| 2014 | $2,440 | $199,528 | $25,986 | $173,542 |
Source: Public Records
Map
Nearby Homes
- 100 W El Camino Real Unit 40
- 813 Montgomery St
- 950 Boranda Ave Unit 12
- 260 Velarde St
- 314 Lavender Dr
- 1451 Tyler Park Way
- 231 Hope St
- 225 Hope St
- 221 Hope St
- 229 Hope St
- 191 E El Camino Real Unit 138
- 191 E El Camino Real Unit 260
- 191 E El Camino Real Unit 146
- 958 California St
- 956 Trophy Dr
- 1515 Miramonte Ave
- 395 Martens Ave
- 119 Easy St Unit 7
- 411 Hedgerow Ct
- 2025 Yorkshire Way
- 802 Calderon Ave
- 780 Calderon Ave
- 810 Calderon Ave
- 768 Calderon Ave
- 675A Ehrhorn Ave
- 675 Ehrhorn Ave
- 675 Ehrhorn Ave Unit A
- 812 Calderon Ave
- 756 Calderon Ave
- 681A Ehrhorn Ave
- 671 Ehrhorn Ave
- 685 Ehrhorn Ave
- 793 Calderon Ave
- 822 Calderon Ave
- 752 Calderon Ave
- 717 Ehrhorn Ave Unit B
- 717 Ehrhorn Ave Unit A
- 717 Ehrhorn Ave
- 663 Ehrhorn Ave
- 727 Ehrhorn Ave
Your Personal Tour Guide
Ask me questions while you tour the home.