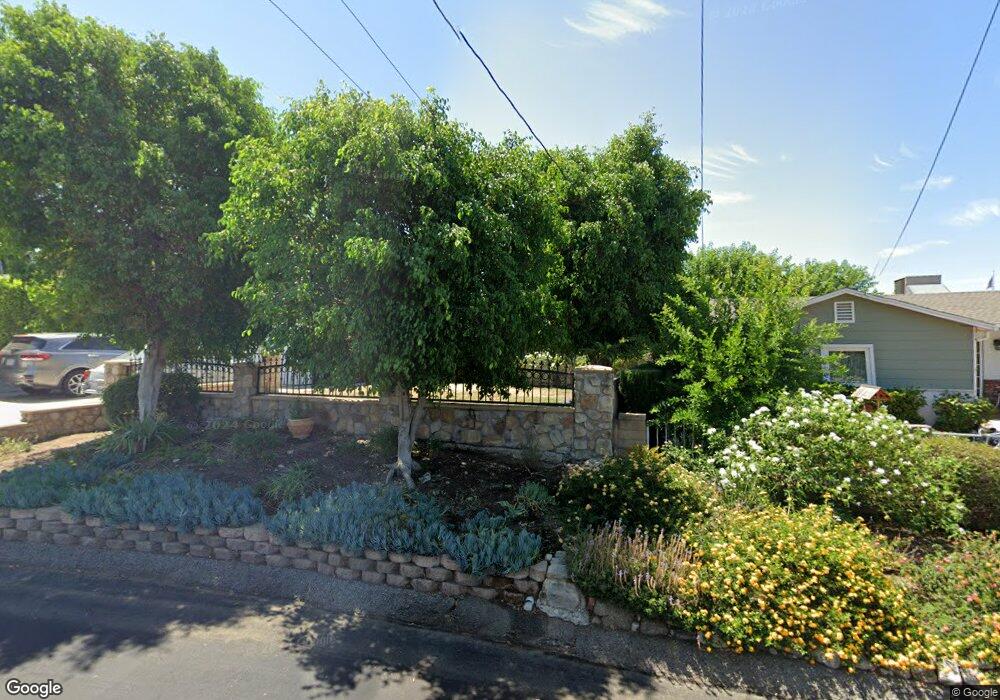
7924 Kyle St Sunland, CA 91040
Sunland NeighborhoodEstimated Value: $784,765 - $949,000
2
Beds
2
Baths
1,119
Sq Ft
$772/Sq Ft
Est. Value
About This Home
This home is located at 7924 Kyle St, Sunland, CA 91040 and is currently estimated at $863,941, approximately $772 per square foot. 7924 Kyle St is a home located in Los Angeles County with nearby schools including Mt. Gleason Middle School, Verdugo Hills Senior High School, and Plainview Academic Charter Academy.
Ownership History
Date
Name
Owned For
Owner Type
Purchase Details
Closed on
Sep 4, 2018
Sold by
Tuboly Lidia and The Modesta Crawford Living Tr
Bought by
Tuboly Lidia
Current Estimated Value
Purchase Details
Closed on
Jul 27, 2009
Sold by
Crawford Modesta
Bought by
Crawford Modesta and The Modesta Crawford Living Tr
Purchase Details
Closed on
Apr 21, 2008
Sold by
Edumunds Rob and Edmunds Bonnie Louise
Bought by
Crawford Modesta
Create a Home Valuation Report for This Property
The Home Valuation Report is an in-depth analysis detailing your home's value as well as a comparison with similar homes in the area
Home Values in the Area
Average Home Value in this Area
Purchase History
| Date | Buyer | Sale Price | Title Company |
|---|---|---|---|
| Tuboly Lidia | -- | None Available | |
| Crawford Modesta | -- | None Available | |
| Crawford Modesta | $325,000 | Stewart Title Company |
Source: Public Records
Tax History Compared to Growth
Tax History
| Year | Tax Paid | Tax Assessment Tax Assessment Total Assessment is a certain percentage of the fair market value that is determined by local assessors to be the total taxable value of land and additions on the property. | Land | Improvement |
|---|---|---|---|---|
| 2025 | $5,314 | $426,877 | $341,508 | $85,369 |
| 2024 | $5,314 | $418,508 | $334,812 | $83,696 |
| 2023 | $5,214 | $410,303 | $328,248 | $82,055 |
| 2022 | $4,976 | $402,259 | $321,812 | $80,447 |
| 2021 | $4,914 | $394,372 | $315,502 | $78,870 |
| 2020 | $4,960 | $390,329 | $312,267 | $78,062 |
| 2019 | $4,770 | $382,677 | $306,145 | $76,532 |
| 2018 | $4,652 | $375,175 | $300,143 | $75,032 |
| 2017 | $4,549 | $367,819 | $294,258 | $73,561 |
| 2016 | $4,442 | $360,608 | $288,489 | $72,119 |
| 2015 | $4,378 | $355,192 | $284,156 | $71,036 |
| 2014 | $4,400 | $348,235 | $278,590 | $69,645 |
Source: Public Records
Map
Nearby Homes
- 10623 Woodward Ave
- 7851 Fenwick St
- 7848 Forsythe St
- 10529 Mount Gleason Ave
- 7755 Forsythe St
- 8230 Hillrose St
- 10404 Leolang Ave
- 8110 Brownstone St
- 10430 Mcvine Ave
- 7541 Hillrose St
- 10554 Plainview Ave
- 10429 Mcvine Ave
- 10415 Mcvine Ave Unit 2
- 7961 Apperson St
- 10300 Whitegate Ave
- 10621 Helendale Ave
- 10917 Tujunga Canyon Blvd
- 10704 Oro Vista Ave
- 7961 Day St
- 10437 Helendale Ave