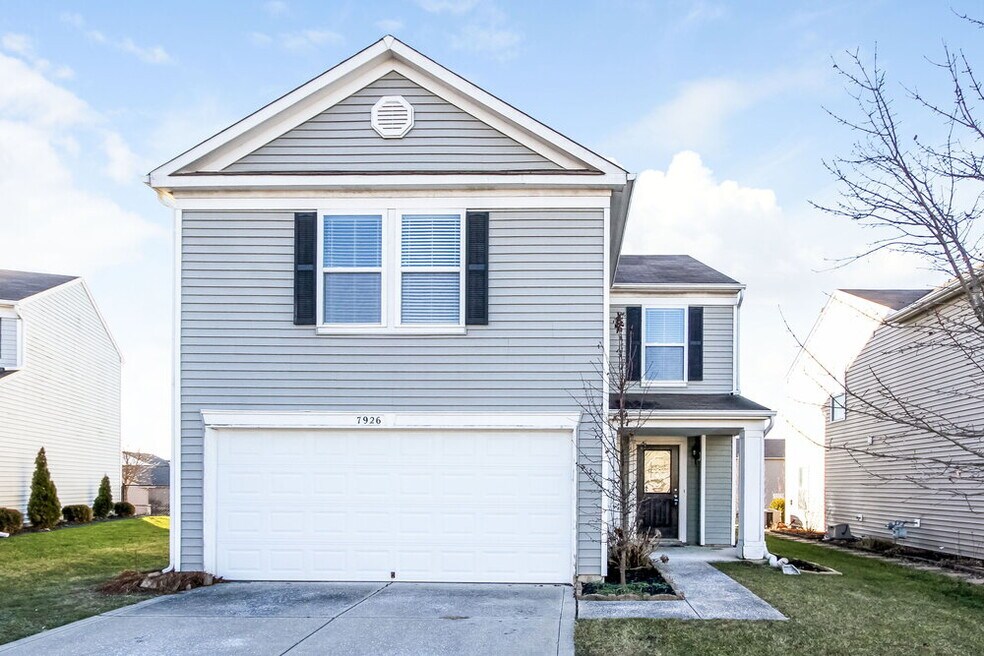
7926 Hydrangea Ct Camby, IN 46113
Camby NeighborhoodAbout This Home
Please note, our homes are available on a first-come, first-serve basis and are not reserved until the holding fee agreement is signed and the holding fee is paid by the primary applicant.
This home features Progress Smart Home - Progress Residential's smart home app, which allows you to control the home securely from any of your devices. Learn more at
This home is priced to rent and won't be around for long. Apply now, while we make this home ready for you, or call to arrange a meeting with your local Progress Residential leasing specialist today.
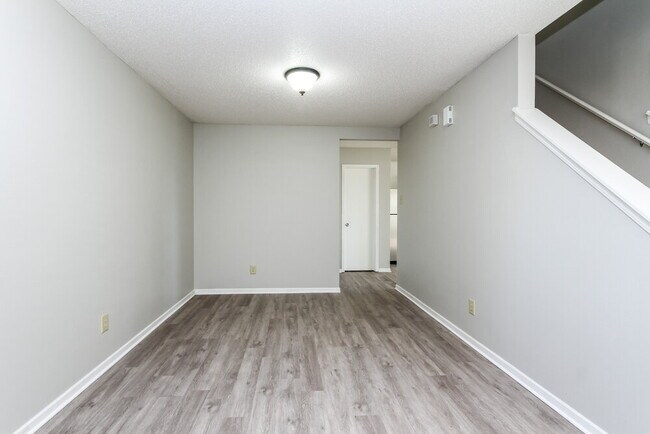
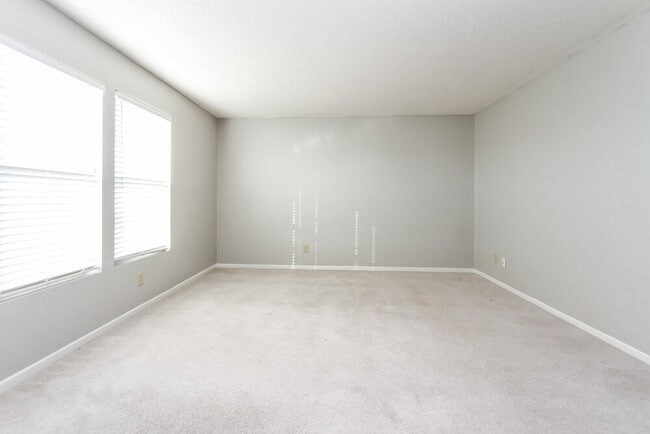
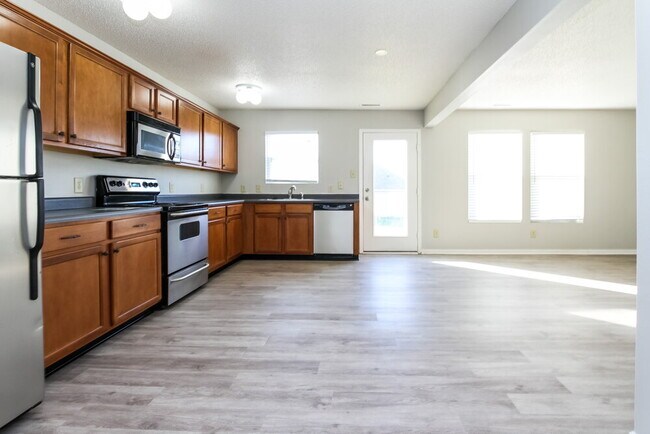
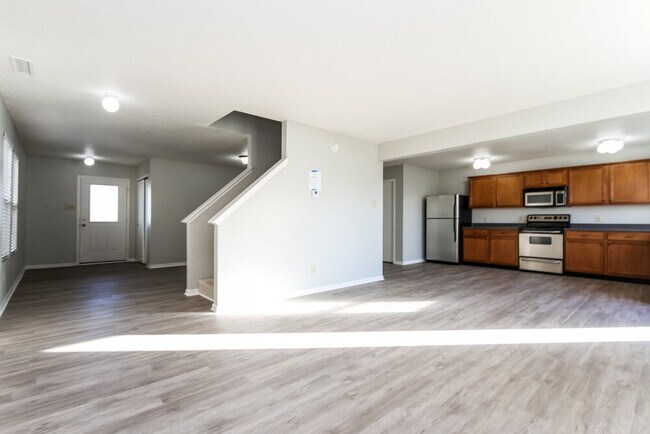
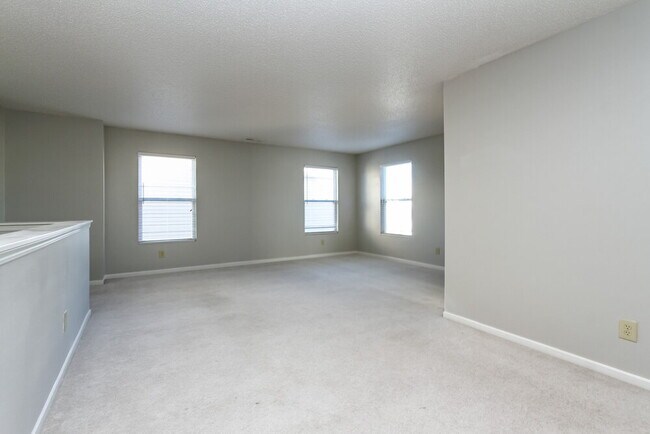
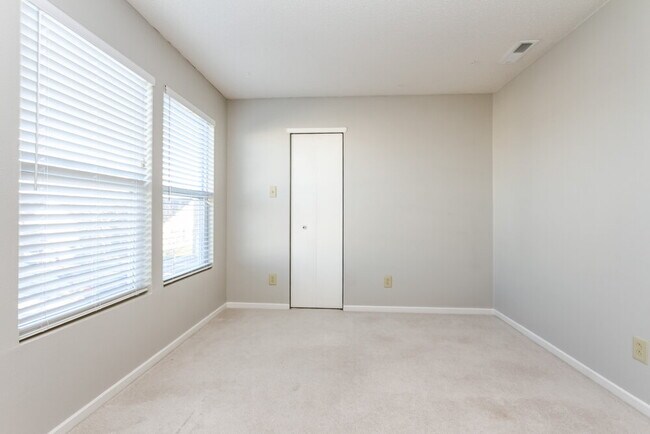
Interested in this home? You clearly have exceptional taste. This charming 3-bedroom, 2.0-bathroom home is not only pet-friendly, but also equipped with smart home features to make everyday life more convenient and connected. Homes like this don’t stay on the market for long—don’t miss your chance to make it yours. Apply today!
The Homeowners Association (HOA) for this home has a separate application process that applicants will need to complete in addition to Progress Residential's application. This includes self-registering with the HOA, completing the HOA's approval process, and paying any fees required by the HOA.
Some images have been virtually staged to help showcase the potential of spaces in the home. The furnishings shown are for illustrative purposes only and are not included in the home.

Map
- 8805 Hosta Way
- 8849 W Mooresville Rd
- 9000 W Mooresville Rd
- Simplicity 2629 Plan at Oberlin - Simplicity Series
- Simplicity 2517 Plan at Oberlin - Simplicity Series
- Simplicity 1531 Plan at Oberlin - Simplicity Series
- Simplicity 2115 Plan at Oberlin - Simplicity Series
- Simplicity 1796 Plan at Oberlin - Simplicity Series
- Simplicity 1350 Plan at Oberlin - Simplicity Series
- Simplicity 1953 Plan at Oberlin - Simplicity Series
- Simplicity 2364 Plan at Oberlin - Simplicity Series
- Simplicity 1594 Plan at Oberlin - Simplicity Series
- Simplicity 2868 Plan at Oberlin - Simplicity Series
- 8734 Hollander Dr
- 8726 Hollander Dr
- 7513 Firecrest Ln
- 7509 Firecrest Ln
- 7505 Firecrest Ln
- 7501 Firecrest Ln
- 8342 Centenary Dr
- 7938 Hydrangea Ct
- 8902 Hosta Way
- 9016 Hosta Way
- 7705 Harborside Dr
- 7715 Firecrest Ln
- 8431 Sansa St
- 7719 Boleru Dr
- 8845 Limberlost Ct
- 8835 Youngs Creek Ln
- 8514 Bluff Point Dr
- 7402 Camby Crossing Dr
- 9117 Cherry Grove Ct
- 8396 E Gunnoah Way
- 9209 Stones Bluff Place
- 8818 Browns Valley Ln
- 8649 Hopewell Ct
- 7214 Griffon Ln
- 10975 Walnut Grove Bend
- 8680 Walnut Grove Dr
- 10879 Walnut Grove Bend