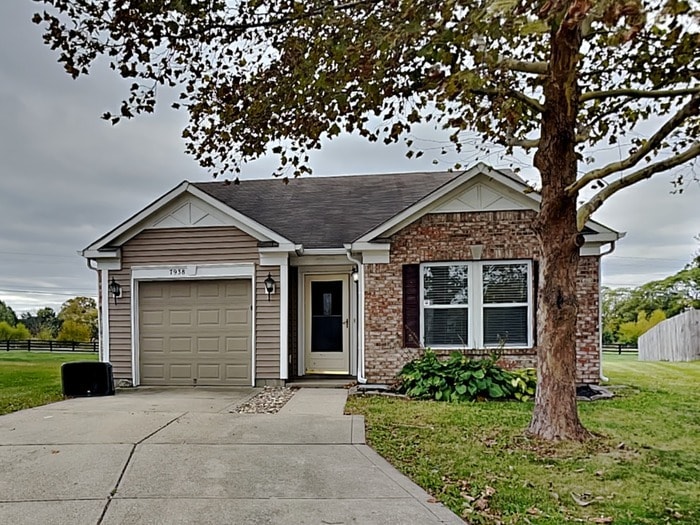
7938 Hydrangea Ct Camby, IN 46113
Camby NeighborhoodAbout This Home
All Bridge Homes listings are pet-friendly and offer easy self-tours -- schedule yours today!
Transparent Pricing with Resident Benefits included: $1,536 Base Rent plus $29 RBP, Total $1,565.
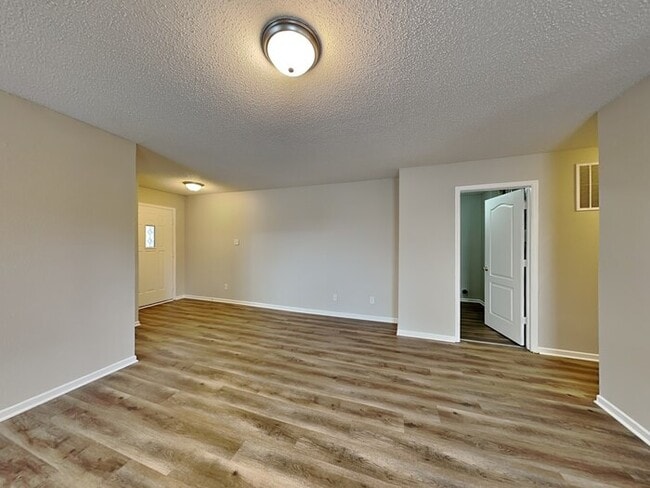
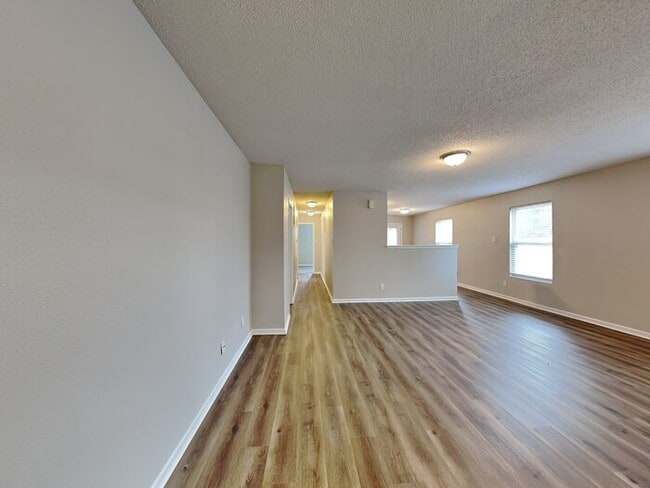
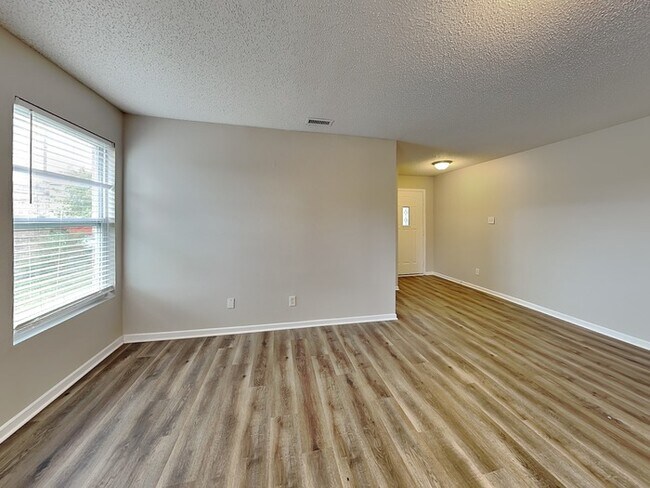
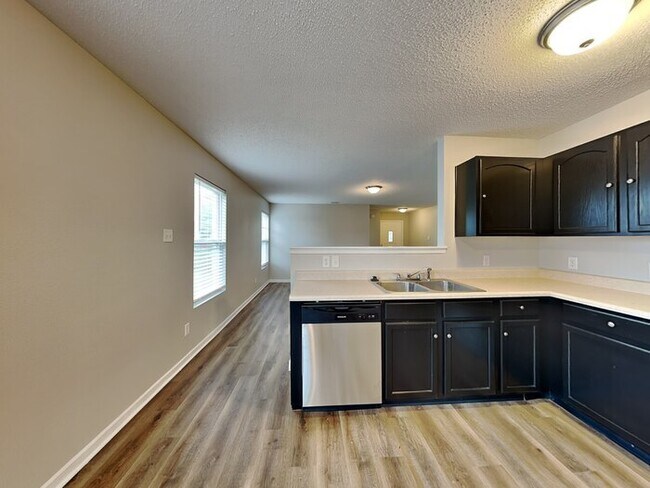
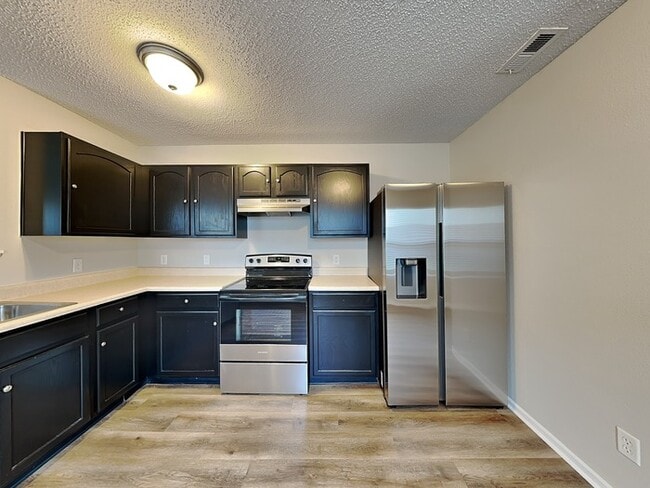
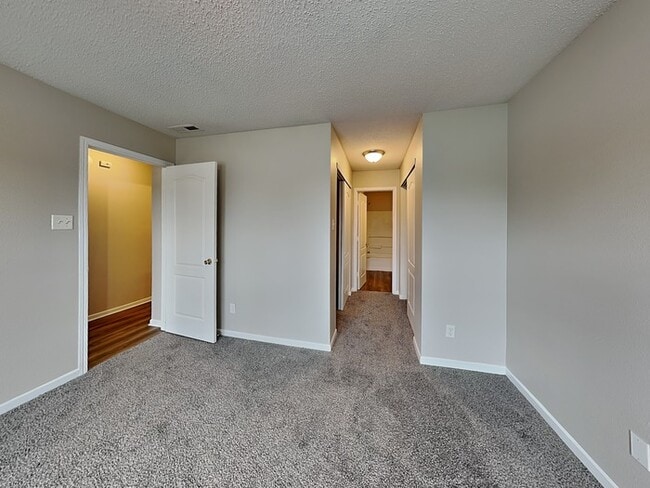
Nestled in a culdesac, this 3-bedroom, 2-bath ranch includes a large living room and spacious closets! You'll find all new flooring throughout the home with LVP in the living room and kitchen and carpet in the bedrooms. Additional features include a laundry/utility room, attached 1-car garage and stainless steel appliances.
All Bridge Homes residents are automatically enrolled in our Resident Benefits Package (RBP), designed to enhance your leasing experience. Your advertised rent already includes this $29 monthly packageno hidden fees. RBP delivers valuable services like a personalized utility concierge, air filter delivery, credit building, and resident rewards. Full details available upon request.
Equal Housing Opportunity.
This property allows self guided viewing without an appointment. Contact for details.

Map
Property History
| Date | Event | Price | List to Sale | Price per Sq Ft | Prior Sale |
|---|---|---|---|---|---|
| 11/26/2025 11/26/25 | Price Changed | $1,565 | -3.1% | $1 / Sq Ft | |
| 09/26/2025 09/26/25 | For Rent | $1,615 | +11.4% | -- | |
| 08/17/2022 08/17/22 | Rented | $1,450 | 0.0% | -- | |
| 08/02/2022 08/02/22 | Price Changed | $1,450 | -3.0% | $1 / Sq Ft | |
| 07/20/2022 07/20/22 | Price Changed | $1,495 | -3.2% | $1 / Sq Ft | |
| 07/15/2022 07/15/22 | For Rent | $1,545 | +48.6% | -- | |
| 05/12/2017 05/12/17 | Rented | $1,040 | 0.0% | -- | |
| 05/10/2017 05/10/17 | Price Changed | $1,040 | -0.5% | $1 / Sq Ft | |
| 03/16/2017 03/16/17 | Price Changed | $1,045 | -2.8% | $1 / Sq Ft | |
| 02/17/2017 02/17/17 | Price Changed | $1,075 | -4.4% | $1 / Sq Ft | |
| 02/08/2017 02/08/17 | Price Changed | $1,124 | -4.3% | $1 / Sq Ft | |
| 12/06/2016 12/06/16 | For Rent | $1,175 | +17.6% | -- | |
| 10/02/2015 10/02/15 | Rented | $999 | 0.0% | -- | |
| 09/22/2015 09/22/15 | Under Contract | -- | -- | -- | |
| 08/06/2015 08/06/15 | For Rent | $999 | 0.0% | -- | |
| 12/10/2013 12/10/13 | Sold | $85,000 | -9.5% | $69 / Sq Ft | View Prior Sale |
| 11/10/2013 11/10/13 | Pending | -- | -- | -- | |
| 11/06/2013 11/06/13 | Price Changed | $93,900 | -6.0% | $77 / Sq Ft | |
| 08/31/2013 08/31/13 | For Sale | $99,900 | -- | $81 / Sq Ft |
- 8805 Hosta Way
- 8849 W Mooresville Rd
- 9000 W Mooresville Rd
- Simplicity 2629 Plan at Oberlin - Simplicity Series
- Simplicity 2517 Plan at Oberlin - Simplicity Series
- Simplicity 1531 Plan at Oberlin - Simplicity Series
- Simplicity 2115 Plan at Oberlin - Simplicity Series
- Simplicity 1796 Plan at Oberlin - Simplicity Series
- Simplicity 1350 Plan at Oberlin - Simplicity Series
- Simplicity 1953 Plan at Oberlin - Simplicity Series
- Simplicity 2364 Plan at Oberlin - Simplicity Series
- Simplicity 1594 Plan at Oberlin - Simplicity Series
- Simplicity 2868 Plan at Oberlin - Simplicity Series
- 8734 Hollander Dr
- 8342 Centenary Dr
- 8726 Hollander Dr
- 7513 Firecrest Ln
- 7509 Firecrest Ln
- 7505 Firecrest Ln
- 7501 Firecrest Ln
- 7926 Hydrangea Ct
- 8902 Hosta Way
- 9016 Hosta Way
- 7705 Harborside Dr
- 7715 Firecrest Ln
- 7719 Boleru Dr
- 8845 Limberlost Ct
- 8348 Burket Way
- 8835 Youngs Creek Ln
- 8514 Bluff Point Dr
- 7402 Camby Crossing Dr
- 9117 Cherry Grove Ct
- 8396 E Gunnoah Way
- 8818 Browns Valley Ln
- 8649 Hopewell Ct
- 10975 Walnut Grove Bend
- 7214 Griffon Ln
- 8680 Walnut Grove Dr
- 10879 Walnut Grove Bend
- 10548 Glenayr Dr