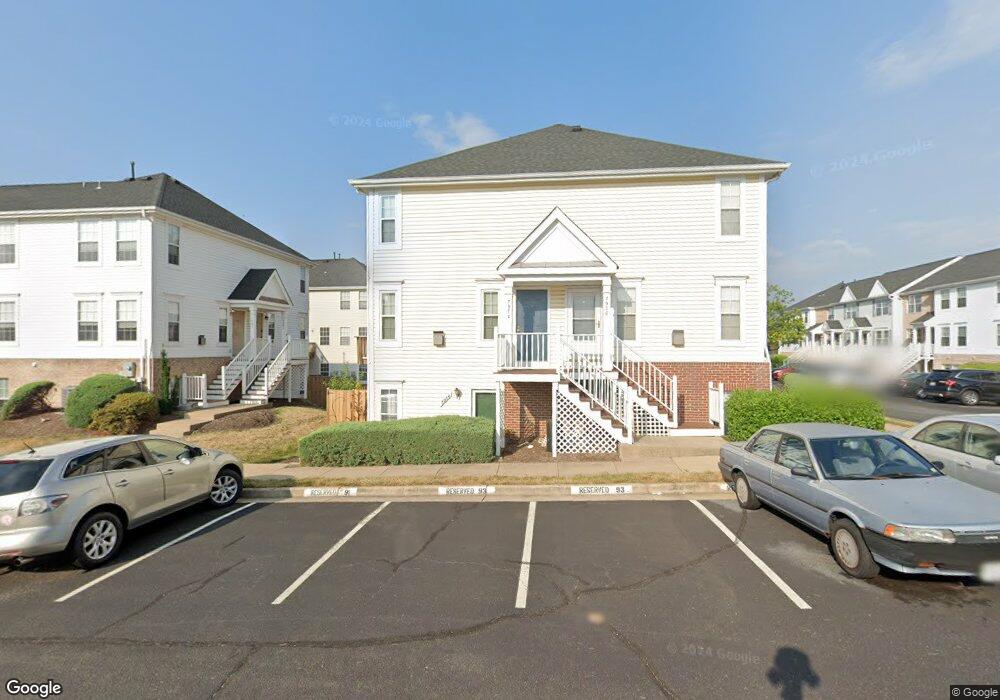
7970 Copperfield Way Manassas, VA 20109
Estimated Value: $306,000 - $321,000
2
Beds
2
Baths
947
Sq Ft
$332/Sq Ft
Est. Value
About This Home
This home is located at 7970 Copperfield Way, Manassas, VA 20109 and is currently estimated at $314,698, approximately $332 per square foot. 7970 Copperfield Way is a home located in Prince William County with nearby schools including George P. Mullen Elementary School, Unity Braxton Middle School, and Unity Reed High School.
Ownership History
Date
Name
Owned For
Owner Type
Purchase Details
Closed on
Sep 14, 2001
Sold by
Senavitis James W
Bought by
Morgan Stephen P
Current Estimated Value
Home Financials for this Owner
Home Financials are based on the most recent Mortgage that was taken out on this home.
Original Mortgage
$56,000
Outstanding Balance
$21,837
Interest Rate
6.99%
Estimated Equity
$292,861
Purchase Details
Closed on
Jun 27, 1994
Sold by
Hovnanian@Bull Run K
Bought by
Senavitis James W
Home Financials for this Owner
Home Financials are based on the most recent Mortgage that was taken out on this home.
Original Mortgage
$85,550
Interest Rate
8.74%
Purchase Details
Closed on
Mar 30, 1994
Sold by
Pulte Home
Bought by
Rossi David W
Home Financials for this Owner
Home Financials are based on the most recent Mortgage that was taken out on this home.
Original Mortgage
$138,050
Interest Rate
7.07%
Mortgage Type
Purchase Money Mortgage
Create a Home Valuation Report for This Property
The Home Valuation Report is an in-depth analysis detailing your home's value as well as a comparison with similar homes in the area
Home Values in the Area
Average Home Value in this Area
Purchase History
| Date | Buyer | Sale Price | Title Company |
|---|---|---|---|
| Morgan Stephen P | $106,000 | -- | |
| Senavitis James W | $87,393 | -- | |
| Rossi David W | $138,475 | -- |
Source: Public Records
Mortgage History
| Date | Status | Borrower | Loan Amount |
|---|---|---|---|
| Open | Morgan Stephen P | $56,000 | |
| Previous Owner | Rossi David W | $85,550 | |
| Previous Owner | Rossi David W | $138,050 |
Source: Public Records
Tax History Compared to Growth
Tax History
| Year | Tax Paid | Tax Assessment Tax Assessment Total Assessment is a certain percentage of the fair market value that is determined by local assessors to be the total taxable value of land and additions on the property. | Land | Improvement |
|---|---|---|---|---|
| 2025 | $2,715 | $303,900 | $91,000 | $212,900 |
| 2024 | $2,715 | $273,000 | $83,000 | $190,000 |
| 2023 | $2,569 | $246,900 | $76,500 | $170,400 |
| 2022 | $2,646 | $238,900 | $74,500 | $164,400 |
| 2021 | $2,615 | $212,000 | $60,900 | $151,100 |
| 2020 | $3,106 | $200,400 | $60,900 | $139,500 |
| 2019 | $2,883 | $186,000 | $58,100 | $127,900 |
| 2018 | $2,129 | $176,300 | $58,100 | $118,200 |
| 2017 | $2,118 | $169,200 | $50,600 | $118,600 |
| 2016 | $2,023 | $162,900 | $50,600 | $112,300 |
| 2015 | $1,795 | $157,400 | $45,600 | $111,800 |
| 2014 | $1,795 | $140,800 | $41,900 | $98,900 |
Source: Public Records
Map
Nearby Homes
- 7967 Calvary Ct
- 7937 Rebel Walk Dr
- 11010 Koman Cir
- 8083 Lacy Dr Unit 101
- 11002 Koman Cir Unit 103
- 7905 Rebel Walk Dr
- 7860 Rebel Walk Dr
- 8068 Stonewall Brigade Ct Unit 204
- 11005 Kinship Ct Unit 303
- 10700 Winfield Loop
- 7945 Blue Gray Cir
- 11184 Stagestone Way
- 10874 Stone Hill Ln
- 11112 Stagestone Way
- 7858 Blue Gray Cir
- 10875 Stone Hill Ln
- 7879 Apache Ridge Ct
- 7849 Sabre Ct
- 11353 Kessler Place
- 11007 Hiram Ct
- 7974 Copperfield Way
- 7974 Copperfield Way Unit 91
- 7972 Copperfield Way
- 11049 Sentry Ridge Rd
- 11049 Sentry Ridge Rd Unit 94
- 11051 Sentry Ridge Rd
- 11051 Sentry Ridge Rd Unit 95
- 11053 Sentry Ridge Rd Unit 96
- 7982 Copperfield Way
- 11055 Sentry Ridge Rd Unit 97
- 7980 Copperfield Way
- 7984 Copperfield Way
- 8001 Lantern Ct
- 8001 Lantern Ct Unit 98
- 11040 Sentry Ridge Rd
- 11038 Sentry Ridge Rd
- 11038 Sentry Ridge Rd Unit 132
- 8003 Lantern Ct
- 8003 Lantern Ct Unit 99