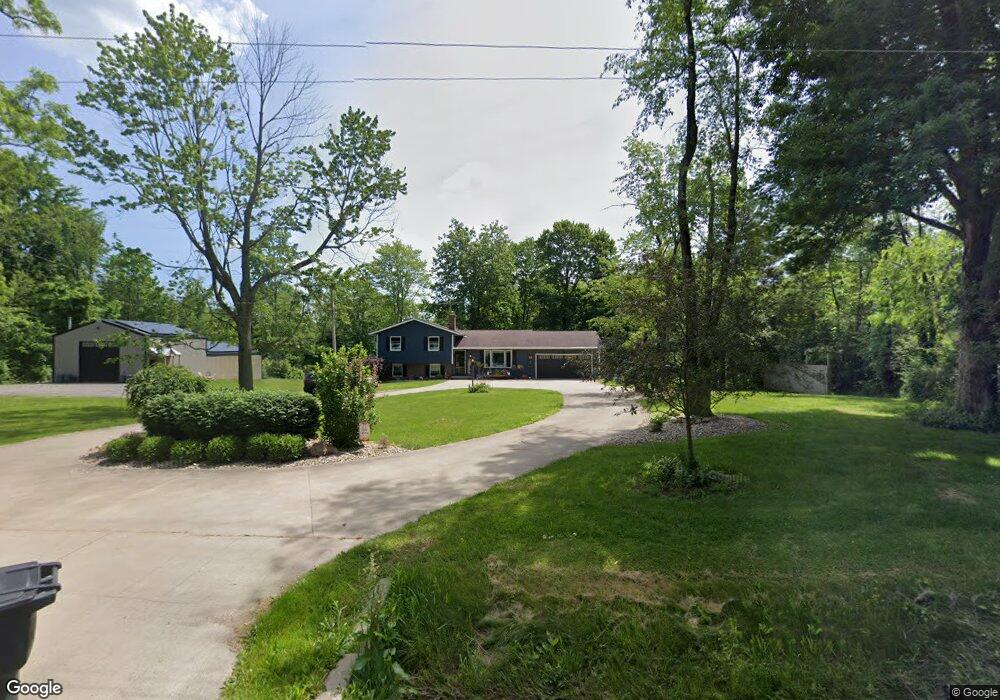
7995 Yoder Rd Seville, OH 44273
Estimated Value: $399,047 - $481,000
4
Beds
1
Bath
1,276
Sq Ft
$346/Sq Ft
Est. Value
About This Home
This home is located at 7995 Yoder Rd, Seville, OH 44273 and is currently estimated at $441,512, approximately $346 per square foot. 7995 Yoder Rd is a home located in Medina County with nearby schools including Valley View Elementary School, Central Intermediate School, and Wadsworth Middle School.
Ownership History
Date
Name
Owned For
Owner Type
Purchase Details
Closed on
Sep 24, 2021
Sold by
Halstead Sonja L and Halstead Wayne A
Bought by
Schaller Michael J and Fryfogle-Schaller Krista M
Current Estimated Value
Home Financials for this Owner
Home Financials are based on the most recent Mortgage that was taken out on this home.
Original Mortgage
$289,000
Interest Rate
2.1%
Mortgage Type
New Conventional
Purchase Details
Closed on
Aug 25, 2016
Sold by
Potter Wayne A
Bought by
Potter Wayne A and Halstead Sonja L
Purchase Details
Closed on
Jun 27, 2014
Sold by
Dick Kevin L and Dick Sheila A
Bought by
Potter Wayne A
Home Financials for this Owner
Home Financials are based on the most recent Mortgage that was taken out on this home.
Original Mortgage
$185,576
Interest Rate
4.2%
Mortgage Type
FHA
Create a Home Valuation Report for This Property
The Home Valuation Report is an in-depth analysis detailing your home's value as well as a comparison with similar homes in the area
Purchase History
| Date | Buyer | Sale Price | Title Company |
|---|---|---|---|
| Schaller Michael J | $340,000 | Michael Brittany | |
| Potter Wayne A | -- | None Available | |
| Potter Wayne A | $189,000 | Transfer Title Agency Inc |
Source: Public Records
Mortgage History
| Date | Status | Borrower | Loan Amount |
|---|---|---|---|
| Previous Owner | Schaller Michael J | $289,000 | |
| Previous Owner | Potter Wayne A | $185,576 |
Source: Public Records
Tax History
| Year | Tax Paid | Tax Assessment Tax Assessment Total Assessment is a certain percentage of the fair market value that is determined by local assessors to be the total taxable value of land and additions on the property. | Land | Improvement |
|---|---|---|---|---|
| 2024 | $5,278 | $127,800 | $59,090 | $68,710 |
| 2023 | $5,711 | $127,800 | $59,090 | $68,710 |
| 2022 | $5,141 | $114,800 | $59,060 | $55,740 |
| 2021 | $4,123 | $77,390 | $43,750 | $33,640 |
| 2020 | $3,762 | $77,390 | $43,750 | $33,640 |
| 2019 | $3,768 | $77,390 | $43,750 | $33,640 |
| 2018 | $3,367 | $64,680 | $35,140 | $29,540 |
| 2017 | $3,368 | $64,680 | $35,140 | $29,540 |
| 2016 | $3,433 | $64,680 | $35,140 | $29,540 |
| 2015 | $3,274 | $58,800 | $31,940 | $26,860 |
| 2014 | $2,795 | $58,800 | $31,940 | $26,860 |
| 2013 | $2,798 | $58,800 | $31,940 | $26,860 |
Source: Public Records
Map
Nearby Homes
- 3556 Blake Rd
- 4293 Good Rd
- 7014 River Styx Rd
- 6984 River Styx Rd
- 8421 Wadsworth Rd
- 3269 Greenwich Rd
- 6961 Bear Swamp Rd
- 2015 Osage Trail
- 4044 Hedgewood Dr
- 4702 Paradise Rd
- 4300 Poe Rd
- 4186 Maidstone Ln
- 6445 Foxglove Dr
- 6470 Aberdeen Ln
- 6576 Torington Dr
- 866 Lawrence Dr
- 6564 Torington Dr
- 6761 Montville Reserve Ln
- 4517 Brownstone Ln
- 1045 Ashley Taylor Ct Unit 14
- 7969 Yoder Rd
- 7990 Yoder Rd
- 8024 Yoder Rd
- 7970 Yoder Rd
- 7950 Yoder Rd
- 8045 Yoder Rd
- 8061 Yoder Rd
- 7924 Yoder Rd
- 3324 Styx Hill Rd
- 8076 Yoder Rd
- 3310 Styx Hill Rd
- V/L Styx Hill Rd
- 3348 Styx Hill Rd
- 3323 Styx Hill Rd
- 3396 Styx Hill Rd Unit 3404
- 8057 Tower Rd
- 8085 Yoder Rd
- 8084 Yoder Rd
- 3341 Styx Hill Rd
- 3359 Styx Hill Rd
Your Personal Tour Guide
Ask me questions while you tour the home.