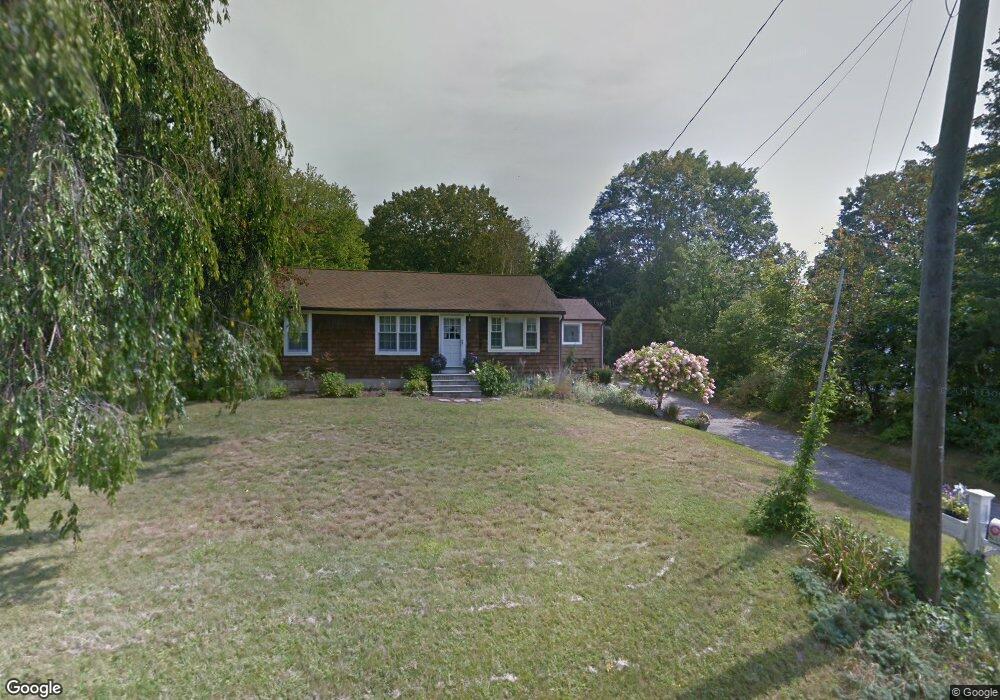
8 Cherry St Sandy Hook, CT 06482
Estimated Value: $419,753 - $519,000
2
Beds
2
Baths
1,240
Sq Ft
$369/Sq Ft
Est. Value
About This Home
This home is located at 8 Cherry St, Sandy Hook, CT 06482 and is currently estimated at $457,438, approximately $368 per square foot. 8 Cherry St is a home located in Fairfield County with nearby schools including Sandy Hook Elementary School, Reed Intermediate School, and Newtown Middle School.
Ownership History
Date
Name
Owned For
Owner Type
Purchase Details
Closed on
Nov 23, 1993
Sold by
Adams Glenn and Adams Elizabeth
Bought by
House Pamela
Current Estimated Value
Home Financials for this Owner
Home Financials are based on the most recent Mortgage that was taken out on this home.
Original Mortgage
$113,600
Interest Rate
6.77%
Mortgage Type
Unknown
Create a Home Valuation Report for This Property
The Home Valuation Report is an in-depth analysis detailing your home's value as well as a comparison with similar homes in the area
Home Values in the Area
Average Home Value in this Area
Purchase History
| Date | Buyer | Sale Price | Title Company |
|---|---|---|---|
| House Pamela | $142,000 | -- | |
| House Pamela | $142,000 | -- |
Source: Public Records
Mortgage History
| Date | Status | Borrower | Loan Amount |
|---|---|---|---|
| Open | House Pamela | $25,000 | |
| Closed | House Pamela | $150,000 | |
| Closed | House Pamela | $130,000 | |
| Closed | House Pamela | $113,600 |
Source: Public Records
Tax History
| Year | Tax Paid | Tax Assessment Tax Assessment Total Assessment is a certain percentage of the fair market value that is determined by local assessors to be the total taxable value of land and additions on the property. | Land | Improvement |
|---|---|---|---|---|
| 2025 | $6,374 | $221,770 | $66,150 | $155,620 |
| 2024 | $5,981 | $221,770 | $66,150 | $155,620 |
| 2023 | $5,819 | $221,770 | $66,150 | $155,620 |
| 2022 | $5,437 | $156,820 | $65,840 | $90,980 |
| 2021 | $5,434 | $156,820 | $65,840 | $90,980 |
| 2020 | $5,451 | $156,820 | $65,840 | $90,980 |
| 2019 | $5,453 | $156,820 | $65,840 | $90,980 |
| 2018 | $5,370 | $156,820 | $65,840 | $90,980 |
| 2017 | $3,972 | $117,280 | $44,590 | $72,690 |
| 2016 | $3,941 | $117,280 | $44,590 | $72,690 |
| 2015 | $3,878 | $117,280 | $44,590 | $72,690 |
| 2014 | $3,907 | $117,280 | $44,590 | $72,690 |
Source: Public Records
Map
Nearby Homes
- 5 Cherry Heights Terrace
- 4 Sunnyview Terrace
- 56 Walnut Tree Hill Rd
- 6 Crestwood Dr
- 7 Dayton St
- 177 Julia Ct Unit 177
- 17 Buttonball Dr
- 123 Louis Hill Rd
- 25 Saint George Place
- 41 Chipmunk Trail
- 12 Valley Field Rd S
- 108 Riverside Rd
- 16A Pole Bridge Rd
- 32 Old Green Rd
- 7 Ford Rd
- 22 Hemlock Trail
- 89 Alpine Dr
- 4 Shady Rest Blvd
- 22 Misty Vale Rd
- 5 Shepaug Rd
- 10 Cherry St
- 6 Cherry St
- 3 Goodyear Rd
- 4 Cherry St
- 1 Cherry Heights Terrace
- 9 Cherry St
- 39 Riverside Rd
- 12 Cherry St
- 5 Cherry St
- 41 Riverside Rd
- 3 Cherry St
- 2 Cherry St
- 14 Cherry St
- 4 Black Cherry Ln
- 43 Riverside Rd
- 8 Black Cherry Ln
- 6 Black Cherry Ln
- 4 Cherry Heights Terrace
- 45 Riverside Rd
- 10 Black Cherry Ln
Your Personal Tour Guide
Ask me questions while you tour the home.