Estimated Value: $1,452,899 - $1,677,000
4
Beds
4
Baths
3,529
Sq Ft
$438/Sq Ft
Est. Value
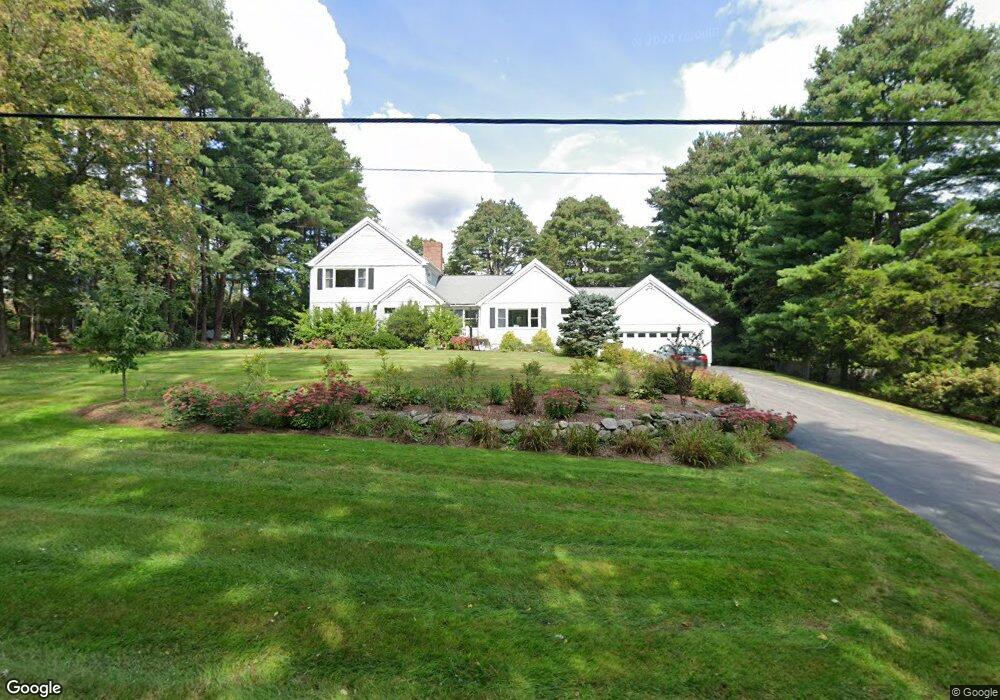
About This Home
This home is located at 8 Cranberry Ln, Dover, MA 02030 and is currently estimated at $1,543,975, approximately $437 per square foot. 8 Cranberry Ln is a home located in Norfolk County with nearby schools including Chickering Elementary School, Dover-Sherborn Regional Middle School, and Dover-Sherborn Regional High School.
Ownership History
Date
Name
Owned For
Owner Type
Purchase Details
Closed on
Aug 21, 2021
Sold by
Medoff Benjamin D and Saint Florian Alisia
Bought by
Nolan Tara L
Current Estimated Value
Purchase Details
Closed on
Jun 11, 2004
Sold by
Lamb Maureen F and Lamb Robert C
Bought by
Stflorian Alisia E and Medoff Benjamin D
Home Financials for this Owner
Home Financials are based on the most recent Mortgage that was taken out on this home.
Original Mortgage
$707,200
Interest Rate
5.99%
Mortgage Type
Purchase Money Mortgage
Purchase Details
Closed on
Apr 17, 1992
Sold by
Holcolb Richard A
Bought by
Lamb Robert C and Lamb Maureen
Home Financials for this Owner
Home Financials are based on the most recent Mortgage that was taken out on this home.
Original Mortgage
$328,000
Interest Rate
8.75%
Mortgage Type
Purchase Money Mortgage
Purchase Details
Closed on
Apr 25, 1989
Sold by
Calitri Peter A
Bought by
Holcomb Richard A
Create a Home Valuation Report for This Property
The Home Valuation Report is an in-depth analysis detailing your home's value as well as a comparison with similar homes in the area
Home Values in the Area
Average Home Value in this Area
Purchase History
| Date | Buyer | Sale Price | Title Company |
|---|---|---|---|
| Nolan Tara L | $1,350,000 | None Available | |
| Stflorian Alisia E | $884,000 | -- | |
| Lamb Robert C | $425,000 | -- | |
| Holcomb Richard A | $260,000 | -- |
Source: Public Records
Mortgage History
| Date | Status | Borrower | Loan Amount |
|---|---|---|---|
| Previous Owner | Stflorian Alisia E | $707,200 | |
| Previous Owner | Holcomb Richard A | $334,500 | |
| Previous Owner | Holcomb Richard A | $328,000 | |
| Previous Owner | Holcomb Richard A | $14,846 | |
| Previous Owner | Holcomb Richard A | $80,000 |
Source: Public Records
Tax History
| Year | Tax Paid | Tax Assessment Tax Assessment Total Assessment is a certain percentage of the fair market value that is determined by local assessors to be the total taxable value of land and additions on the property. | Land | Improvement |
|---|---|---|---|---|
| 2025 | $13,137 | $1,165,700 | $643,500 | $522,200 |
| 2024 | $12,197 | $1,112,900 | $621,700 | $491,200 |
| 2023 | $12,022 | $986,200 | $545,400 | $440,800 |
| 2022 | $11,384 | $916,600 | $523,600 | $393,000 |
| 2021 | $11,650 | $903,800 | $523,600 | $380,200 |
| 2020 | $11,605 | $903,800 | $523,600 | $380,200 |
| 2019 | $11,686 | $903,800 | $523,600 | $380,200 |
| 2018 | $11,214 | $873,400 | $523,600 | $349,800 |
| 2017 | $10,958 | $839,700 | $480,100 | $359,600 |
| 2016 | $10,815 | $839,700 | $480,100 | $359,600 |
| 2015 | $10,359 | $815,700 | $456,100 | $359,600 |
Source: Public Records
Map
Nearby Homes
- 1 Old Colony Dr
- 62 Claybrook Rd
- 60 Claybrook Rd
- 104 Glen St
- 61 Glen St
- 2 Phillips Pond Rd
- 18 Phillips Pond Rd
- 67 Farm St
- 44 Glen St
- 8 Warren Rd
- 8 Greystone Rd
- 68 Locust Ln
- 25 Bretton Rd
- 9 Buttercup Ln
- 52 Willow St
- 182 Winding River Rd
- 365 Charles River St
- 29 Water St
- 36 Yorkshire Rd
- 1780 Central Ave
Your Personal Tour Guide
Ask me questions while you tour the home.