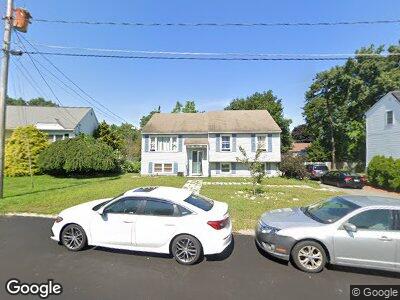
8 Delta Dr Nashua, NH 03060
South End Nashua NeighborhoodEstimated Value: $422,000 - $500,763
3
Beds
1
Bath
1,080
Sq Ft
$426/Sq Ft
Est. Value
About This Home
This home is located at 8 Delta Dr, Nashua, NH 03060 and is currently estimated at $460,441, approximately $426 per square foot. 8 Delta Dr is a home located in Hillsborough County with nearby schools including Sunset Heights Elementary School, Elm Street Middle School, and Nashua High School North.
Ownership History
Date
Name
Owned For
Owner Type
Purchase Details
Closed on
Nov 19, 2018
Sold by
Winfield Keith R and Winfield Theresa T
Bought by
Vargas Jason D and Vargas Arielle N
Current Estimated Value
Home Financials for this Owner
Home Financials are based on the most recent Mortgage that was taken out on this home.
Original Mortgage
$175,750
Interest Rate
4.7%
Mortgage Type
Purchase Money Mortgage
Purchase Details
Closed on
Mar 29, 1993
Bought by
Winfield Keith R and Winfield Theresa T
Create a Home Valuation Report for This Property
The Home Valuation Report is an in-depth analysis detailing your home's value as well as a comparison with similar homes in the area
Home Values in the Area
Average Home Value in this Area
Purchase History
| Date | Buyer | Sale Price | Title Company |
|---|---|---|---|
| Vargas Jason D | $185,000 | -- | |
| Winfield Keith R | $113,900 | -- |
Source: Public Records
Mortgage History
| Date | Status | Borrower | Loan Amount |
|---|---|---|---|
| Open | Vargas Jason D | $193,000 | |
| Closed | Vargas Jason D | $175,750 | |
| Previous Owner | Winfield Keith R | $210,448 |
Source: Public Records
Tax History Compared to Growth
Tax History
| Year | Tax Paid | Tax Assessment Tax Assessment Total Assessment is a certain percentage of the fair market value that is determined by local assessors to be the total taxable value of land and additions on the property. | Land | Improvement |
|---|---|---|---|---|
| 2023 | $7,578 | $415,700 | $124,000 | $291,700 |
| 2022 | $7,512 | $415,700 | $124,000 | $291,700 |
| 2021 | $6,666 | $287,100 | $86,800 | $200,300 |
| 2020 | $6,421 | $284,000 | $86,800 | $197,200 |
| 2019 | $6,180 | $284,000 | $86,800 | $197,200 |
| 2018 | $6,024 | $284,000 | $86,800 | $197,200 |
| 2017 | $5,519 | $214,000 | $78,200 | $135,800 |
| 2016 | $5,365 | $214,000 | $78,200 | $135,800 |
| 2015 | $5,249 | $214,000 | $78,200 | $135,800 |
| 2014 | $5,147 | $214,000 | $78,200 | $135,800 |
Source: Public Records
Map
Nearby Homes