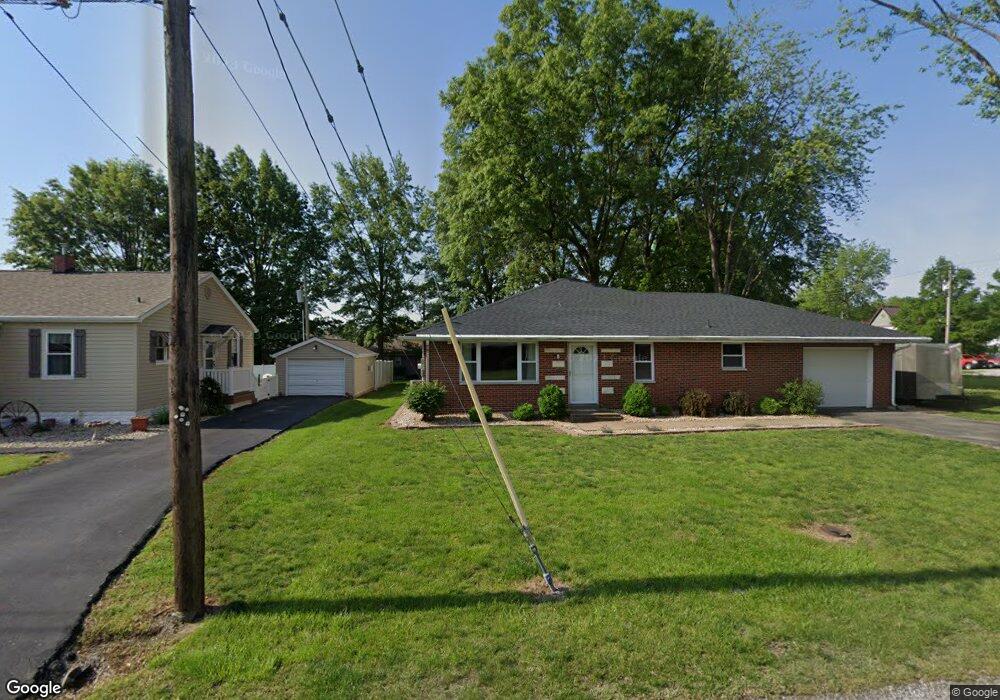
8 E Adams St Millstadt, IL 62260
Estimated Value: $162,000 - $242,000
Studio
--
Bath
1,080
Sq Ft
$192/Sq Ft
Est. Value
About This Home
This home is located at 8 E Adams St, Millstadt, IL 62260 and is currently estimated at $207,889, approximately $192 per square foot. 8 E Adams St is a home located in St. Clair County with nearby schools including Millstadt Consolidated School, Millstadt Primary Center, and St James Catholic School.
Ownership History
Date
Name
Owned For
Owner Type
Purchase Details
Closed on
Aug 31, 2020
Sold by
Pellmann Alex H and Pellmann Paige
Bought by
Goder Devin
Current Estimated Value
Home Financials for this Owner
Home Financials are based on the most recent Mortgage that was taken out on this home.
Original Mortgage
$152,400
Interest Rate
2.9%
Mortgage Type
Future Advance Clause Open End Mortgage
Purchase Details
Closed on
Feb 21, 2017
Sold by
Glaenzer Toni A and Glaenzer Jason A
Bought by
Pellmann Alex H
Home Financials for this Owner
Home Financials are based on the most recent Mortgage that was taken out on this home.
Original Mortgage
$112,800
Interest Rate
4.12%
Mortgage Type
New Conventional
Purchase Details
Closed on
Apr 15, 2015
Sold by
Glaenzer Marsha A
Bought by
Glaenzer Toni A and Glaenzer Jason A
Create a Home Valuation Report for This Property
The Home Valuation Report is an in-depth analysis detailing your home's value as well as a comparison with similar homes in the area
Home Values in the Area
Average Home Value in this Area
Purchase History
| Date | Buyer | Sale Price | Title Company |
|---|---|---|---|
| Goder Devin | $158,000 | Town & Country Title Co | |
| Pellmann Alex H | $141,000 | Illinois Title & Escrow | |
| Glaenzer Toni A | $63,000 | Illinois Title & Escrow |
Source: Public Records
Mortgage History
| Date | Status | Borrower | Loan Amount |
|---|---|---|---|
| Closed | Goder Devin | $152,400 | |
| Previous Owner | Pellmann Alex H | $112,800 |
Source: Public Records
Tax History
| Year | Tax Paid | Tax Assessment Tax Assessment Total Assessment is a certain percentage of the fair market value that is determined by local assessors to be the total taxable value of land and additions on the property. | Land | Improvement |
|---|---|---|---|---|
| 2024 | $3,883 | $59,457 | $11,986 | $47,471 |
| 2023 | $3,652 | $54,042 | $10,894 | $43,148 |
| 2022 | $3,435 | $49,232 | $9,924 | $39,308 |
| 2021 | $3,257 | $45,345 | $9,176 | $36,169 |
| 2020 | $2,794 | $37,881 | $8,039 | $29,842 |
| 2019 | $2,686 | $37,881 | $8,039 | $29,842 |
| 2018 | $2,572 | $36,515 | $7,749 | $28,766 |
| 2017 | $2,843 | $36,020 | $7,644 | $28,376 |
| 2016 | $2,595 | $29,800 | $5,217 | $24,583 |
| 2014 | $1,376 | $28,629 | $5,012 | $23,617 |
| 2013 | $2,500 | $27,297 | $4,779 | $22,518 |
Source: Public Records
Map
Nearby Homes
- 800 S Main St
- 312 E Madison St
- 71 Josiah Ln
- 13 N Jackson St
- 19 Adderly Ln
- 339 E Mill St
- 411 W Mill St
- 130 Regency Place
- 408 W Gooding St
- 109 Benham Dr
- 125 Gladwyn Dr
- 113 Adderly Ln
- 201 Adderly Ln
- 10 Coronation Dr
- 855 M and O Station Rd
- 12 Gemstone Dr
- 112 Liederkranz Ln
- 3295 Veranda Ct
- 334 Spring Lake Rd
- 6409 Balsam Ridge
- 14 E Adams St
- 11 E Van Buren St
- 610 S Jefferson St
- 610 S Jefferson St
- 610 S Jefferson St
- 610 S Jefferson St
- 610 S Jefferson St
- 609 S Breese St
- 11 E Adams St
- 514 S Jefferson St
- 15 E Van Buren St
- 15 E Adams St
- 19 E Adams St
- 601 S Jefferson St
- 23 E Adams St
- 510 S Jefferson St
- 25 E Van Buren St
- 615 S Jefferson St
- 12 E Elm St
- 517 S Jefferson St
Your Personal Tour Guide
Ask me questions while you tour the home.