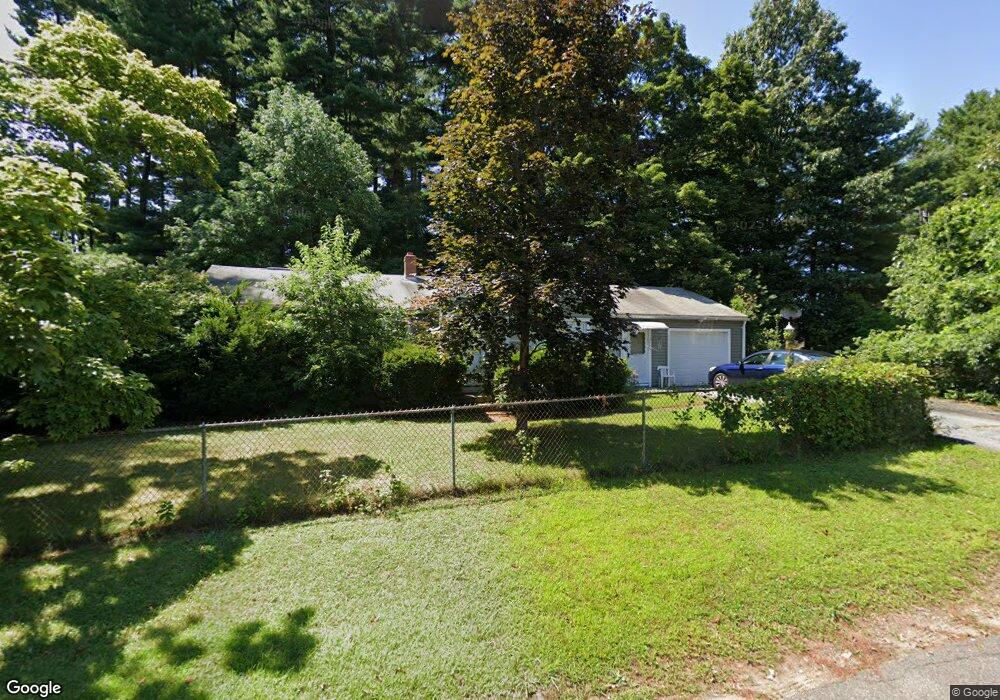
8 Flint St Springfield, MA 01129
Boston Road NeighborhoodEstimated Value: $275,000 - $310,000
3
Beds
1
Bath
1,068
Sq Ft
$276/Sq Ft
Est. Value
About This Home
This home is located at 8 Flint St, Springfield, MA 01129 and is currently estimated at $294,700, approximately $275 per square foot. 8 Flint St is a home located in Hampden County with nearby schools including Warner, M Marcus Kiley Middle, and Springfield Central High School.
Ownership History
Date
Name
Owned For
Owner Type
Purchase Details
Closed on
Sep 29, 1995
Sold by
General Supply & Loan and Weisenberg Roslyn
Bought by
Johnson Sylvester and Johnson Marion M
Current Estimated Value
Home Financials for this Owner
Home Financials are based on the most recent Mortgage that was taken out on this home.
Original Mortgage
$66,450
Outstanding Balance
$479
Interest Rate
7.89%
Mortgage Type
Purchase Money Mortgage
Estimated Equity
$294,221
Create a Home Valuation Report for This Property
The Home Valuation Report is an in-depth analysis detailing your home's value as well as a comparison with similar homes in the area
Home Values in the Area
Average Home Value in this Area
Purchase History
| Date | Buyer | Sale Price | Title Company |
|---|---|---|---|
| Johnson Sylvester | $66,500 | -- |
Source: Public Records
Mortgage History
| Date | Status | Borrower | Loan Amount |
|---|---|---|---|
| Open | Johnson Sylvester | $66,450 | |
| Previous Owner | Johnson Sylvester | $25,000 |
Source: Public Records
Tax History
| Year | Tax Paid | Tax Assessment Tax Assessment Total Assessment is a certain percentage of the fair market value that is determined by local assessors to be the total taxable value of land and additions on the property. | Land | Improvement |
|---|---|---|---|---|
| 2025 | $3,807 | $242,800 | $60,800 | $182,000 |
| 2024 | $3,755 | $233,800 | $60,800 | $173,000 |
| 2023 | $3,686 | $216,200 | $57,800 | $158,400 |
| 2022 | $3,531 | $187,600 | $57,800 | $129,800 |
| 2021 | $3,275 | $173,300 | $52,600 | $120,700 |
| 2020 | $3,125 | $160,000 | $52,600 | $107,400 |
| 2019 | $2,877 | $146,200 | $52,600 | $93,600 |
| 2018 | $2,944 | $149,600 | $52,600 | $97,000 |
| 2017 | $2,754 | $140,100 | $47,600 | $92,500 |
| 2016 | $2,644 | $134,500 | $47,600 | $86,900 |
| 2015 | $2,640 | $134,200 | $47,600 | $86,600 |
Source: Public Records
Map
Nearby Homes
Your Personal Tour Guide
Ask me questions while you tour the home.