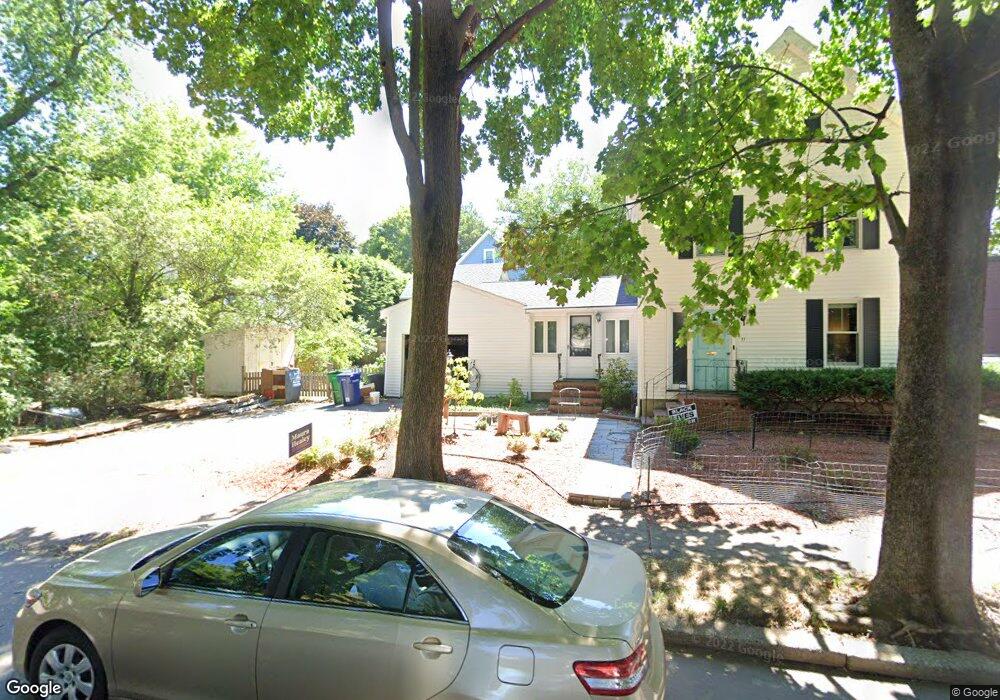
8 Jepsen Ct West Newton, MA 02465
West Newton NeighborhoodEstimated Value: $779,000 - $1,793,000
5
Beds
3
Baths
2,344
Sq Ft
$587/Sq Ft
Est. Value
About This Home
This home is located at 8 Jepsen Ct, West Newton, MA 02465 and is currently estimated at $1,376,667, approximately $587 per square foot. 8 Jepsen Ct is a home located in Middlesex County with nearby schools including Franklin Elementary School, C.C. Burr, and F.A. Day Middle School.
Ownership History
Date
Name
Owned For
Owner Type
Purchase Details
Closed on
Sep 30, 1992
Sold by
Bowery Sb
Bought by
Cohen Harvey L and Cohen Benjamin
Current Estimated Value
Home Financials for this Owner
Home Financials are based on the most recent Mortgage that was taken out on this home.
Original Mortgage
$113,750
Interest Rate
7.83%
Mortgage Type
Purchase Money Mortgage
Purchase Details
Closed on
Feb 28, 1992
Sold by
Grishin Michael B
Bought by
Bowery Sb
Create a Home Valuation Report for This Property
The Home Valuation Report is an in-depth analysis detailing your home's value as well as a comparison with similar homes in the area
Home Values in the Area
Average Home Value in this Area
Purchase History
| Date | Buyer | Sale Price | Title Company |
|---|---|---|---|
| Cohen Harvey L | $162,500 | -- | |
| Bowery Sb | $165,500 | -- |
Source: Public Records
Mortgage History
| Date | Status | Borrower | Loan Amount |
|---|---|---|---|
| Closed | Bowery Sb | $113,750 |
Source: Public Records
Tax History Compared to Growth
Tax History
| Year | Tax Paid | Tax Assessment Tax Assessment Total Assessment is a certain percentage of the fair market value that is determined by local assessors to be the total taxable value of land and additions on the property. | Land | Improvement |
|---|---|---|---|---|
| 2025 | $11,301 | $1,153,200 | $673,600 | $479,600 |
| 2024 | $10,927 | $1,119,600 | $654,000 | $465,600 |
| 2023 | $10,354 | $1,017,100 | $508,600 | $508,500 |
| 2022 | $10,407 | $989,300 | $470,900 | $518,400 |
| 2021 | $9,766 | $907,600 | $432,000 | $475,600 |
| 2020 | $9,475 | $907,600 | $432,000 | $475,600 |
| 2019 | $8,864 | $848,200 | $403,700 | $444,500 |
| 2018 | $8,782 | $811,600 | $378,800 | $432,800 |
| 2017 | $8,280 | $744,600 | $347,500 | $397,100 |
| 2016 | $7,774 | $683,100 | $318,800 | $364,300 |
| 2015 | $7,412 | $638,400 | $297,900 | $340,500 |
Source: Public Records
Map
Nearby Homes
- 41 Kilburn Rd
- 287 Cherry St Unit 2
- 371 Cherry St
- 53-55 N Gate Park
- 106 River St Unit 18
- 106 River St Unit 2
- 106 River St Unit 14
- 2 Elm St Unit 6
- 2 Elm St Unit 8
- 44 Westland Ave
- 66 Webster St
- 429 Cherry St Unit 11
- 56 Dearborn St
- 212 River St Unit 2
- 42 Evergreen Cir
- 90 Auburndale Ave
- 79 Chestnut St Unit 2
- 27 Cross St Unit 27
- 12 Inis Cir
- 318 Austin St Unit A
- 11 Jepsen Ct Unit 2
- 11 Jepsen Ct
- 11 Henshaw Place
- 13 Henshaw Terrace Unit 15
- 13 Henshaw Terrace Unit 13
- 38 Lindbergh Ave
- 30 Lindbergh Ave
- 7 Henshaw Terrace
- 7 Henshaw Place
- 26 Lindbergh Ave
- 39 Henshaw St
- 39 Henshaw St Unit 2
- 33 Henshaw St
- 12 Henshaw Place
- 12 Henshaw Terrace
- 50 Lindbergh Ave
- 18 Henshaw Terrace Unit 2
- 18 Henshaw Terrace Unit 1
- 18 Henshaw Terrace Unit B
- 16 Henshaw Terrace