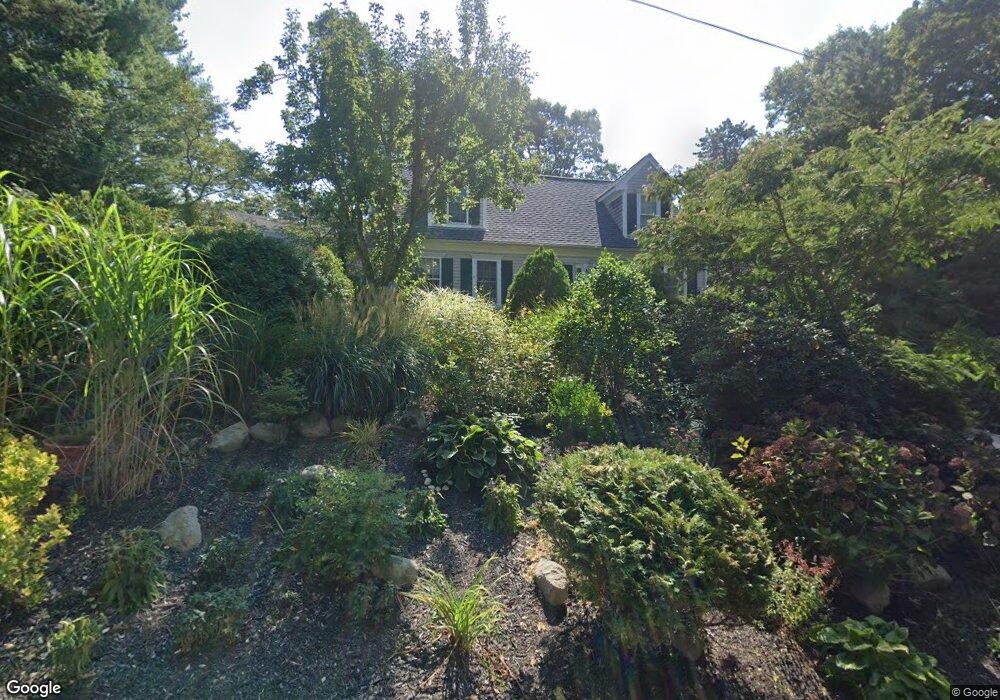
8 Mutiny Way Mashpee, MA 02649
Mashpee Neck NeighborhoodEstimated Value: $693,000 - $833,000
3
Beds
2
Baths
1,501
Sq Ft
$498/Sq Ft
Est. Value
About This Home
This home is located at 8 Mutiny Way, Mashpee, MA 02649 and is currently estimated at $747,316, approximately $497 per square foot. 8 Mutiny Way is a home located in Barnstable County with nearby schools including Kenneth C. Coombs School, Quashnet School, and Mashpee Middle School.
Ownership History
Date
Name
Owned For
Owner Type
Purchase Details
Closed on
Oct 15, 2024
Sold by
Kota Stephen D and Blake Heidi A
Bought by
Kota Stephen and Stephen Kota
Current Estimated Value
Purchase Details
Closed on
Mar 10, 2017
Sold by
Kota Stephen D and Kota Steven D
Bought by
Kota Stephen D and Blake Heidi A
Purchase Details
Closed on
Sep 27, 2004
Sold by
Thompson Valerie A
Bought by
Kota Stephen D
Home Financials for this Owner
Home Financials are based on the most recent Mortgage that was taken out on this home.
Original Mortgage
$70,000
Interest Rate
5.89%
Mortgage Type
Purchase Money Mortgage
Purchase Details
Closed on
Apr 28, 2000
Sold by
Oyster Dev Llp
Bought by
Kota Steven D and Thompson Valerie A
Purchase Details
Closed on
Dec 1, 1999
Sold by
Paulin Philip E
Bought by
Even Ursula
Create a Home Valuation Report for This Property
The Home Valuation Report is an in-depth analysis detailing your home's value as well as a comparison with similar homes in the area
Home Values in the Area
Average Home Value in this Area
Purchase History
| Date | Buyer | Sale Price | Title Company |
|---|---|---|---|
| Kota Stephen | -- | None Available | |
| Stephen Kota T | -- | None Available | |
| Kota Stephen | -- | None Available | |
| Kota Stephen D | -- | -- | |
| Kota Stephen D | $16,000 | -- | |
| Kota Steven D | $185,000 | -- | |
| Even Ursula | $45,000 | -- | |
| Kota Stephen D | -- | -- | |
| Kota Stephen D | $16,000 | -- | |
| Kota Steven D | $185,000 | -- | |
| Even Ursula | $45,000 | -- |
Source: Public Records
Mortgage History
| Date | Status | Borrower | Loan Amount |
|---|---|---|---|
| Previous Owner | Kota Stephen D | $70,000 | |
| Previous Owner | Even Ursula | $247,000 |
Source: Public Records
Tax History
| Year | Tax Paid | Tax Assessment Tax Assessment Total Assessment is a certain percentage of the fair market value that is determined by local assessors to be the total taxable value of land and additions on the property. | Land | Improvement |
|---|---|---|---|---|
| 2025 | $4,323 | $653,000 | $238,700 | $414,300 |
| 2024 | $3,826 | $595,100 | $217,100 | $378,000 |
| 2023 | $3,623 | $516,800 | $206,700 | $310,100 |
| 2022 | $3,470 | $424,700 | $168,000 | $256,700 |
| 2021 | $30,306 | $375,800 | $151,400 | $224,400 |
| 2020 | $22,555 | $364,300 | $145,600 | $218,700 |
| 2019 | $3,176 | $350,900 | $145,600 | $205,300 |
| 2018 | $3,020 | $338,600 | $145,600 | $193,000 |
| 2017 | $3,099 | $337,200 | $162,400 | $174,800 |
| 2016 | $3,020 | $326,800 | $162,400 | $164,400 |
| 2015 | $2,912 | $319,700 | $162,400 | $157,300 |
| 2014 | $2,973 | $316,600 | $159,800 | $156,800 |
Source: Public Records
Map
Nearby Homes
- 20 Mutiny Way
- 239 Clamshell Cove Rd
- 12 Tracey Rd
- 52 Old Dock Ln
- 85 Clamshell Cove Rd
- 35 Spinnaker Dr W
- 11 Teal Cir
- 640 Poponessett Rd
- 640 Poponessett Rd
- 61 Shoestring Bay Rd
- 140 Summersea Rd
- 311 Waquoit Rd
- 109 Great Pines Dr
- 10 Shadbush Cir
- 9 Red Cedar Rd Unit 9
- 9 Red Cedar Rd Unit 9
- 102 Summersea Rd
- 17 Degrass Rd
- 34 Rainbow Ln
- 444 Vineyard Rd
- 0 Mutiny Way
- 7 Buccaneer Way
- 14 Mutiny Way
- 2 Mutiny Way
- 9 Mutiny Way
- 13 Buccaneer Way
- 19 Captains Row
- 15 Mutiny Way
- 17 Buccaneer Way
- 35 Captains Row
- 24 Captains Row
- 14 Buccaneer Way
- 23 Buccaneer Way
- 367 Mashpee Neck Rd
- 30 Captains Row
- 41 Captains Row
- 2 Treasure Ln
- 373 Mashpee Neck Rd
- 379 Mashpee Neck Rd
- 35 Buccaneer Way
Your Personal Tour Guide
Ask me questions while you tour the home.