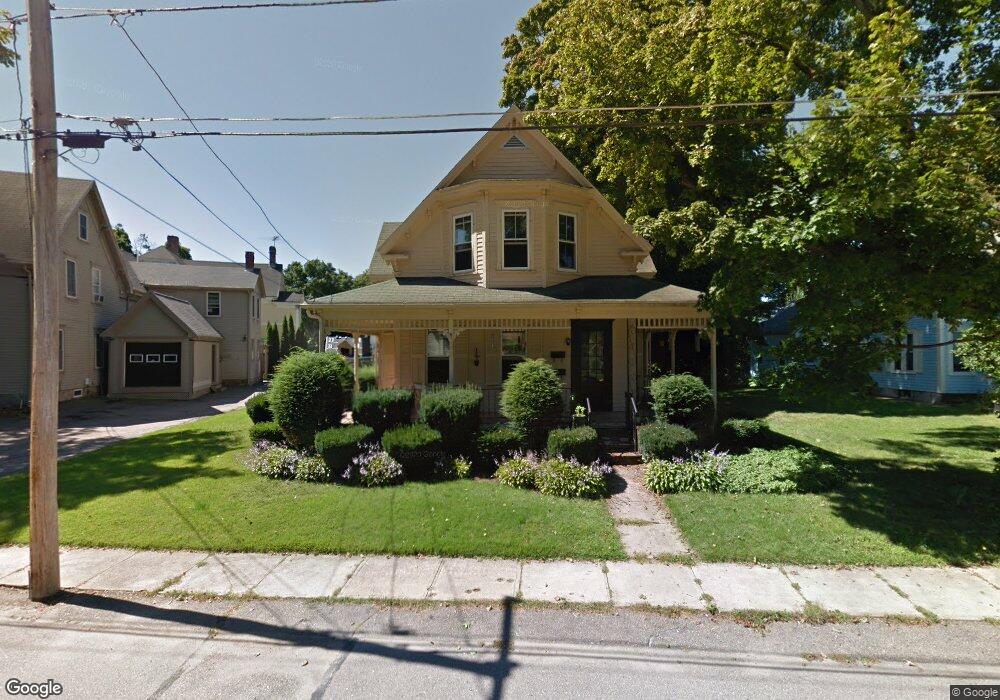
8 Queen St Franklin, MA 02038
Downtown Franklin NeighborhoodEstimated Value: $597,000 - $700,000
8
Beds
5
Baths
2,318
Sq Ft
$288/Sq Ft
Est. Value
About This Home
This home is located at 8 Queen St, Franklin, MA 02038 and is currently estimated at $667,675, approximately $288 per square foot. 8 Queen St is a home located in Norfolk County with nearby schools including Helen Keller Elementary School, Annie Sullivan Middle School, and Franklin High School.
Ownership History
Date
Name
Owned For
Owner Type
Purchase Details
Closed on
Jan 20, 2004
Sold by
Scaccia Peter G and Scaccia Jane
Bought by
Oulton David P
Current Estimated Value
Home Financials for this Owner
Home Financials are based on the most recent Mortgage that was taken out on this home.
Original Mortgage
$255,000
Outstanding Balance
$119,915
Interest Rate
5.98%
Mortgage Type
Purchase Money Mortgage
Estimated Equity
$547,760
Create a Home Valuation Report for This Property
The Home Valuation Report is an in-depth analysis detailing your home's value as well as a comparison with similar homes in the area
Home Values in the Area
Average Home Value in this Area
Purchase History
| Date | Buyer | Sale Price | Title Company |
|---|---|---|---|
| Oulton David P | $340,000 | -- |
Source: Public Records
Mortgage History
| Date | Status | Borrower | Loan Amount |
|---|---|---|---|
| Open | Oulton David P | $255,000 |
Source: Public Records
Tax History
| Year | Tax Paid | Tax Assessment Tax Assessment Total Assessment is a certain percentage of the fair market value that is determined by local assessors to be the total taxable value of land and additions on the property. | Land | Improvement |
|---|---|---|---|---|
| 2025 | $7,311 | $629,200 | $234,500 | $394,700 |
| 2024 | $6,879 | $583,500 | $234,500 | $349,000 |
| 2023 | $6,797 | $540,300 | $256,000 | $284,300 |
| 2022 | $5,753 | $409,500 | $195,400 | $214,100 |
| 2021 | $5,870 | $400,700 | $203,500 | $197,200 |
| 2020 | $5,554 | $382,800 | $205,300 | $177,500 |
| 2019 | $5,033 | $343,300 | $180,100 | $163,200 |
| 2018 | $4,512 | $308,000 | $183,700 | $124,300 |
| 2017 | $4,641 | $318,300 | $180,100 | $138,200 |
| 2016 | $4,504 | $310,600 | $187,100 | $123,500 |
| 2015 | $4,225 | $284,700 | $169,100 | $115,600 |
| 2014 | $4,043 | $279,800 | $164,200 | $115,600 |
Source: Public Records
Map
Nearby Homes
- 88 Crescent St
- 14 Pleasant St Unit B
- 120 Union St Unit 1
- 163 W Central St
- 17 Longhill Rd
- 90 E Central St Unit 304
- 6 Pine Knoll Rd
- 37 Cross St
- 99 Summer St
- 204 Lincoln St
- 35 Padden Rd
- 62 Uncas Ave Unit 1
- 60 Uncas Ave Unit 1
- 5 Flintlocke Rd
- 76 Uncas Ave Unit 1
- 66 Uncas Ave Unit 1
- 68 Uncas Ave Unit 1
- 80 Uncas Ave Unit 1
- 82 Uncas Ave Unit 1
- 78 Highwood Dr
- 61 Crescent St
- 14 Queen St
- 1 Queen St
- 65 Crescent St
- 49 Crescent St
- 51 Crescent St Unit 51
- 20 Queen St
- 13 Queen St
- 73 Crescent St
- 73 Crescent St Unit 1
- 45 Crescent St
- 19 Queen St
- 19 Queen St Unit 2
- 75 Crescent St
- 56 Crescent St
- 28 Queen St
- 28 Garfield St
- 28 Garfield St Unit 1
- 77 Crescent St
- 77 Crescent St Unit 1
Your Personal Tour Guide
Ask me questions while you tour the home.