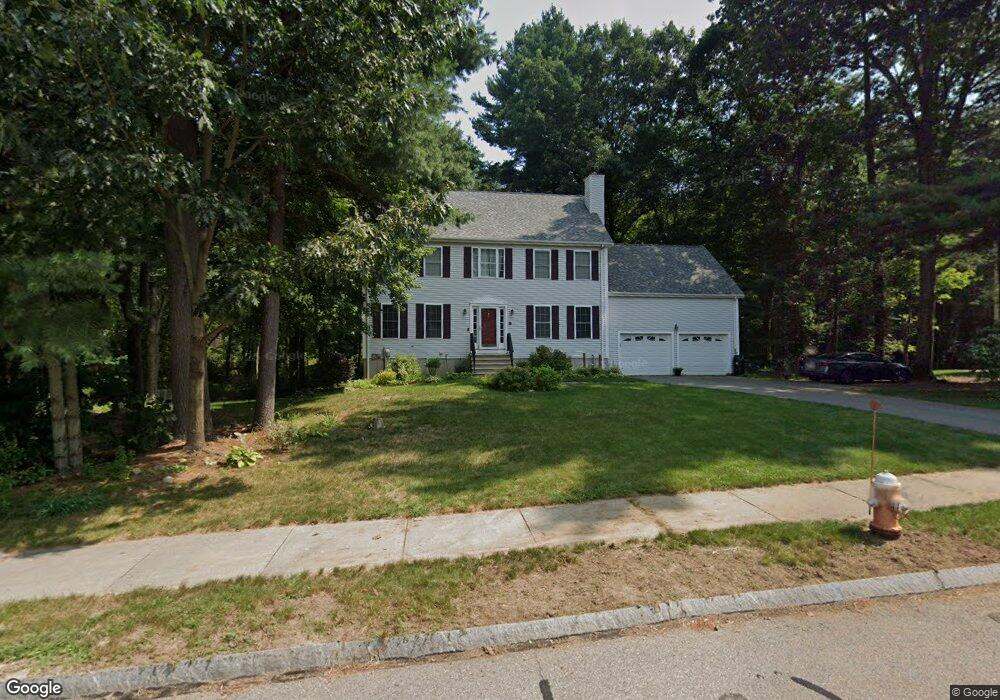
8 Tanglewood Dr Franklin, MA 02038
Estimated Value: $856,000 - $911,000
4
Beds
4
Baths
3,064
Sq Ft
$287/Sq Ft
Est. Value
About This Home
This home is located at 8 Tanglewood Dr, Franklin, MA 02038 and is currently estimated at $878,316, approximately $286 per square foot. 8 Tanglewood Dr is a home located in Norfolk County with nearby schools including John F. Kennedy Memorial School, Horace Mann Middle School, and Franklin High School.
Ownership History
Date
Name
Owned For
Owner Type
Purchase Details
Closed on
Aug 20, 2020
Sold by
Elizabeth M Girstantas Lt
Bought by
Chiaramonte Brian and Chiaramonte Nicole
Current Estimated Value
Home Financials for this Owner
Home Financials are based on the most recent Mortgage that was taken out on this home.
Original Mortgage
$470,000
Outstanding Balance
$416,923
Interest Rate
3%
Mortgage Type
New Conventional
Estimated Equity
$461,393
Purchase Details
Closed on
Nov 17, 2006
Sold by
Bishop James C and Bishop Pamela K
Bought by
Elizabeth Girstantas L and Girstantas Elizabeth M
Purchase Details
Closed on
Jul 9, 1999
Sold by
Partridge Woods Rt
Bought by
Bishop James C
Home Financials for this Owner
Home Financials are based on the most recent Mortgage that was taken out on this home.
Original Mortgage
$240,000
Interest Rate
7.19%
Mortgage Type
Purchase Money Mortgage
Create a Home Valuation Report for This Property
The Home Valuation Report is an in-depth analysis detailing your home's value as well as a comparison with similar homes in the area
Purchase History
| Date | Buyer | Sale Price | Title Company |
|---|---|---|---|
| Chiaramonte Brian | $560,000 | None Available | |
| Elizabeth Girstantas L | $480,000 | -- | |
| Bishop James C | $283,995 | -- |
Source: Public Records
Mortgage History
| Date | Status | Borrower | Loan Amount |
|---|---|---|---|
| Open | Chiaramonte Brian | $470,000 | |
| Previous Owner | Bishop James C | $240,000 |
Source: Public Records
Tax History
| Year | Tax Paid | Tax Assessment Tax Assessment Total Assessment is a certain percentage of the fair market value that is determined by local assessors to be the total taxable value of land and additions on the property. | Land | Improvement |
|---|---|---|---|---|
| 2025 | $8,308 | $715,000 | $339,200 | $375,800 |
| 2024 | $8,267 | $701,200 | $339,200 | $362,000 |
| 2023 | $7,972 | $633,700 | $289,000 | $344,700 |
| 2022 | $7,479 | $532,300 | $227,600 | $304,700 |
| 2021 | $8,018 | $547,300 | $255,700 | $291,600 |
| 2020 | $7,584 | $522,700 | $245,100 | $277,600 |
| 2019 | $7,510 | $512,300 | $234,700 | $277,600 |
| 2018 | $6,970 | $475,800 | $226,300 | $249,500 |
| 2017 | $6,692 | $459,000 | $209,500 | $249,500 |
| 2016 | $6,848 | $472,300 | $224,300 | $248,000 |
| 2015 | $6,843 | $461,100 | $213,100 | $248,000 |
| 2014 | $6,284 | $434,900 | $186,900 | $248,000 |
Source: Public Records
Map
Nearby Homes
- 27 Dover Cir
- 8 Woodhaven Dr
- 60 Pine St
- 41 Kimberlee Ave
- 18 Mary Anne Dr
- 33 Elm St
- 29 Elm St
- 20 Hawthorne Village Unit A
- 276 Pond St
- 4 Linda Ln
- 24 Shayne Rd Unit 110
- 17 Pine St
- 254 Daniels St
- 201 Crossfield Rd
- 91 Oliver Pond Cir Unit 3
- 83 Oliver Pond Cir Unit 7
- 8 Apache Rd
- 1391 Pond St
- 839 Lincoln St
- 44 Arapahoe Rd
- 12 Tanglewood Dr
- 4 Tanglewood Dr
- 11 Tanglewood Dr
- 9 Tanglewood Dr
- 13 Tanglewood Dr
- 16 Tanglewood Dr
- 3 Sierra Dr
- 2 Sierra Dr
- 586 Maple St
- 584 Maple St
- 588 Maple St
- 20 Tanglewood Dr
- 582 Maple St
- 19 Tanglewood Dr
- 580 Maple St
- 0 Lot 15 Tanglewood Dr Unit 50497878
- 0 Lot 1 Tanglewood Dr Unit 50396857
- 590 Maple St
- 3 Oak Tree Ln
- 1 Oak Tree Ln
Your Personal Tour Guide
Ask me questions while you tour the home.