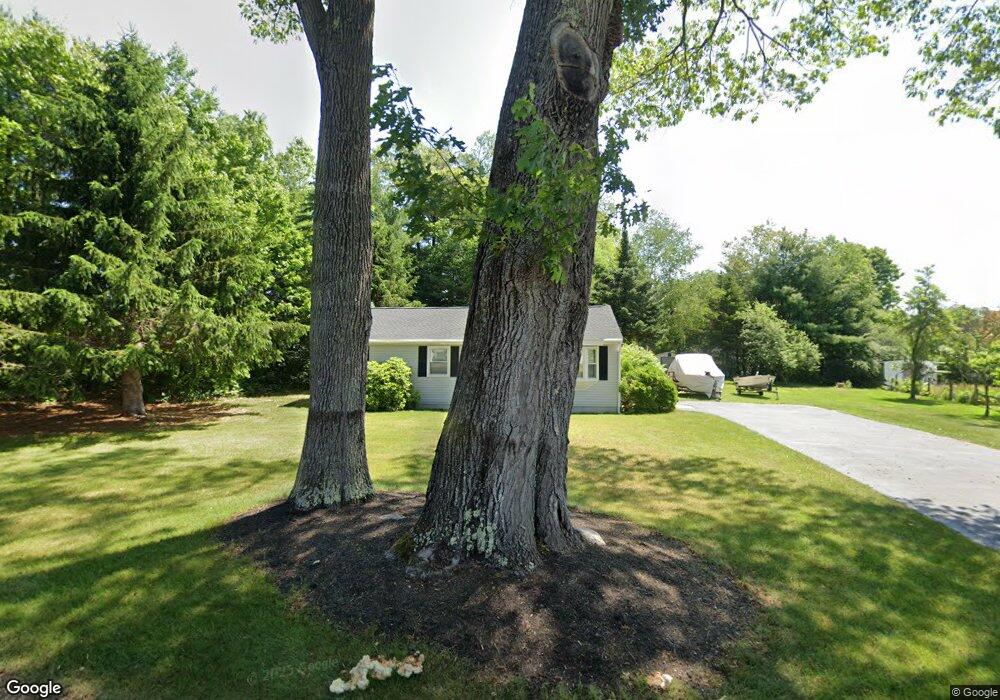
8 Upland Dr Franklin, NH 03235
Estimated Value: $343,950 - $416,000
3
Beds
1
Bath
1,243
Sq Ft
$302/Sq Ft
Est. Value
About This Home
This home is located at 8 Upland Dr, Franklin, NH 03235 and is currently estimated at $374,988, approximately $301 per square foot. 8 Upland Dr is a home located in Merrimack County with nearby schools including Paul A. Smith School, Franklin Middle School, and Franklin High School.
Ownership History
Date
Name
Owned For
Owner Type
Purchase Details
Closed on
Oct 4, 2016
Sold by
Lodge Katherine A
Bought by
Lodge Jr George F
Current Estimated Value
Purchase Details
Closed on
Apr 6, 1999
Sold by
Viens Carole Y
Bought by
Lodge Jr George F
Home Financials for this Owner
Home Financials are based on the most recent Mortgage that was taken out on this home.
Original Mortgage
$60,000
Interest Rate
6.78%
Create a Home Valuation Report for This Property
The Home Valuation Report is an in-depth analysis detailing your home's value as well as a comparison with similar homes in the area
Home Values in the Area
Average Home Value in this Area
Purchase History
| Date | Buyer | Sale Price | Title Company |
|---|---|---|---|
| Lodge Jr George F | -- | -- | |
| Lodge Jr George F | $75,000 | -- |
Source: Public Records
Mortgage History
| Date | Status | Borrower | Loan Amount |
|---|---|---|---|
| Previous Owner | Lodge Jr George F | $144,000 | |
| Previous Owner | Lodge Jr George F | $60,000 |
Source: Public Records
Tax History
| Year | Tax Paid | Tax Assessment Tax Assessment Total Assessment is a certain percentage of the fair market value that is determined by local assessors to be the total taxable value of land and additions on the property. | Land | Improvement |
|---|---|---|---|---|
| 2025 | $4,605 | $261,200 | $108,100 | $153,100 |
| 2024 | $4,480 | $261,200 | $108,100 | $153,100 |
| 2023 | $4,247 | $261,200 | $108,100 | $153,100 |
| 2022 | $4,112 | $168,600 | $90,100 | $78,500 |
| 2021 | $3,913 | $168,600 | $90,100 | $78,500 |
| 2020 | $3,849 | $168,500 | $90,100 | $78,400 |
| 2019 | $3,786 | $168,500 | $90,100 | $78,400 |
| 2018 | $3,700 | $168,500 | $90,100 | $78,400 |
| 2017 | $3,203 | $125,300 | $31,300 | $94,000 |
| 2016 | $3,161 | $125,300 | $31,300 | $94,000 |
| 2015 | $2,188 | $87,710 | $21,910 | $65,800 |
| 2011 | $3,219 | $149,600 | $38,800 | $110,800 |
Source: Public Records
Map
Nearby Homes
- 9 Upland Dr
- lot 24 Route 11
- 00 Summit St Unit 402
- 10 Chance Pond Rd
- 709 S Main St
- 5 Evans Ct
- 29 Elkins St
- 88 Franklin St
- 69 Cheney St
- 18 Highland Ave
- 416 Central St
- 261 N Main St
- 27 A St
- 15 Trail St
- 632 Central St
- 0 Rowell Dr Unit 406 5043422
- 2 Hutchinson St
- 24 Munroe St Unit 1&2
- 40 Millstone Dr Unit 60
- 50 Millstone Dr Unit 57
Your Personal Tour Guide
Ask me questions while you tour the home.