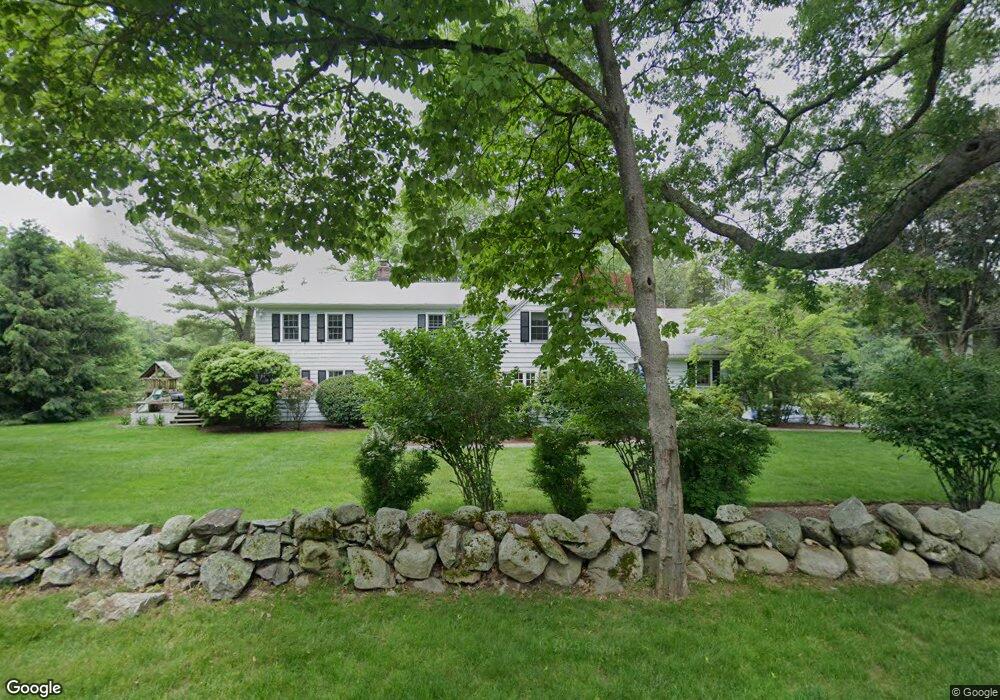
8 Wake Robin Rd Westport, CT 06880
Greens Farms NeighborhoodEstimated Value: $1,890,105 - $2,318,000
6
Beds
4
Baths
3,428
Sq Ft
$626/Sq Ft
Est. Value
About This Home
This home is located at 8 Wake Robin Rd, Westport, CT 06880 and is currently estimated at $2,147,026, approximately $626 per square foot. 8 Wake Robin Rd is a home located in Fairfield County with nearby schools including Green's Farms School, Bedford Middle School, and Staples High School.
Ownership History
Date
Name
Owned For
Owner Type
Purchase Details
Closed on
Sep 1, 2009
Sold by
Essex 3Rd Winfield Scott and Essex Stacey S
Bought by
Menninger Christopher S and Menninger Sarah M
Current Estimated Value
Home Financials for this Owner
Home Financials are based on the most recent Mortgage that was taken out on this home.
Original Mortgage
$708,750
Interest Rate
5.17%
Purchase Details
Closed on
Oct 13, 2004
Sold by
Goldman Robert S and Goldman Christie M
Bought by
Essex 3Rd Winfield Scott and Essex Stacey S
Purchase Details
Closed on
Mar 1, 2000
Sold by
Petersen Robert and Doherty Arlene
Bought by
Goldman Robert and Goldman Christie
Purchase Details
Closed on
Mar 16, 1993
Sold by
Block Fred and Block Judy
Bought by
Peterson Robert and Doherty Arlene
Create a Home Valuation Report for This Property
The Home Valuation Report is an in-depth analysis detailing your home's value as well as a comparison with similar homes in the area
Home Values in the Area
Average Home Value in this Area
Purchase History
| Date | Buyer | Sale Price | Title Company |
|---|---|---|---|
| Menninger Christopher S | $1,050,000 | -- | |
| Menninger Christopher S | $1,050,000 | -- | |
| Essex 3Rd Winfield Scott | $980,000 | -- | |
| Essex 3Rd Winfield Scott | $980,000 | -- | |
| Goldman Robert | $680,000 | -- | |
| Goldman Robert | $680,000 | -- | |
| Peterson Robert | $475,000 | -- | |
| Peterson Robert | $475,000 | -- |
Source: Public Records
Mortgage History
| Date | Status | Borrower | Loan Amount |
|---|---|---|---|
| Open | Peterson Robert | $761,472 | |
| Closed | Peterson Robert | $708,750 |
Source: Public Records
Tax History Compared to Growth
Tax History
| Year | Tax Paid | Tax Assessment Tax Assessment Total Assessment is a certain percentage of the fair market value that is determined by local assessors to be the total taxable value of land and additions on the property. | Land | Improvement |
|---|---|---|---|---|
| 2025 | $14,877 | $788,800 | $450,400 | $338,400 |
| 2024 | $14,687 | $788,800 | $450,400 | $338,400 |
| 2023 | $14,474 | $788,800 | $450,400 | $338,400 |
| 2022 | $14,254 | $788,800 | $450,400 | $338,400 |
| 2021 | $12,438 | $788,800 | $450,400 | $338,400 |
| 2020 | $13,672 | $818,200 | $458,600 | $359,600 |
| 2019 | $5,603 | $818,200 | $458,600 | $359,600 |
| 2018 | $11,900 | $818,200 | $458,600 | $359,600 |
| 2017 | $13,795 | $818,200 | $458,600 | $359,600 |
| 2016 | $13,795 | $818,200 | $458,600 | $359,600 |
| 2015 | $12,270 | $678,300 | $376,000 | $302,300 |
| 2014 | $12,169 | $678,300 | $376,000 | $302,300 |
Source: Public Records
Map
Nearby Homes
- 123 Greens Farms Rd
- 24 Edgemarth Hill Rd
- 68 Center St
- 61 Edgewater Commons Ln
- 221 Greens Farms Rd
- 25 Ellery Ln
- 10 Tierney Ln
- 32 Edgewater Hillside
- 29 Guyer Rd
- 249 Greens Farms Rd
- 46 Compo Mill Cove
- 46 Compo Mill Cove
- 48 Compo Mill Cove
- 109 Morningside Dr S
- 216 Hillspoint Rd
- 785 Post Rd E Unit 301
- 785 Post Rd E Unit 303
- 785 Post Rd E Unit 302
- 785 Post Rd E Unit 201
- 785 Post Rd E Unit 304
- 6 Wake Robin Rd
- 10 Wake Robin Rd
- 9 Wake Robin Rd
- 7 Wake Robin Rd
- 4 Wake Robin Rd
- 12 Wake Robin Rd
- 5 Wake Robin Rd
- 2 Wake Robin Rd
- 14 Wake Robin Rd
- 8 Signal Ln
- 12 River Oaks Rd
- 10 Signal Ln
- 12 Signal Ln
- 15 Wake Robin Rd
- 6 River Oaks Rd
- 150 Greens Farms Rd
- 158 Greens Farms Rd
- 162 Greens Farms Rd
- 11 Signal Ln
- 16 Wake Robin Rd