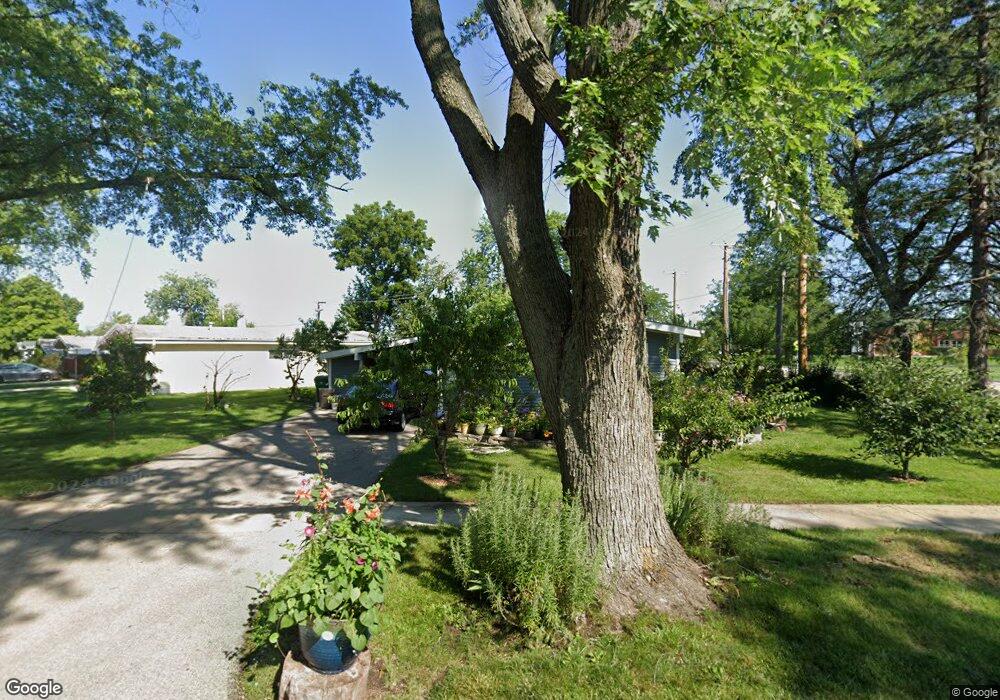
80 E Jeffery Ave Wheeling, IL 60090
Estimated Value: $297,458 - $342,000
3
Beds
2
Baths
1,137
Sq Ft
$286/Sq Ft
Est. Value
About This Home
This home is located at 80 E Jeffery Ave, Wheeling, IL 60090 and is currently estimated at $324,615, approximately $285 per square foot. 80 E Jeffery Ave is a home located in Cook County with nearby schools including Mark Twain Elementary School, Oliver W Holmes Middle School, and Wheeling High School.
Ownership History
Date
Name
Owned For
Owner Type
Purchase Details
Closed on
Jul 9, 2001
Sold by
Cruz Belarmino and Medina Teodula
Bought by
Medina Teodula
Current Estimated Value
Home Financials for this Owner
Home Financials are based on the most recent Mortgage that was taken out on this home.
Original Mortgage
$130,000
Interest Rate
7.27%
Purchase Details
Closed on
Oct 26, 1998
Sold by
Kranz Lois J
Bought by
Cruz Belarmino and Medina Teodula
Home Financials for this Owner
Home Financials are based on the most recent Mortgage that was taken out on this home.
Original Mortgage
$124,736
Interest Rate
7.02%
Mortgage Type
FHA
Purchase Details
Closed on
Feb 9, 1994
Sold by
Kranz Philip L and Kranz Lois J
Bought by
Kranz Lois J
Home Financials for this Owner
Home Financials are based on the most recent Mortgage that was taken out on this home.
Original Mortgage
$58,000
Interest Rate
7.22%
Create a Home Valuation Report for This Property
The Home Valuation Report is an in-depth analysis detailing your home's value as well as a comparison with similar homes in the area
Home Values in the Area
Average Home Value in this Area
Purchase History
| Date | Buyer | Sale Price | Title Company |
|---|---|---|---|
| Medina Teodula | -- | -- | |
| Cruz Belarmino | $126,000 | Professional National Title | |
| Kranz Lois J | -- | -- |
Source: Public Records
Mortgage History
| Date | Status | Borrower | Loan Amount |
|---|---|---|---|
| Closed | Medina Teodula | $130,000 | |
| Previous Owner | Cruz Belarmino | $124,736 | |
| Previous Owner | Kranz Lois J | $58,000 |
Source: Public Records
Tax History
| Year | Tax Paid | Tax Assessment Tax Assessment Total Assessment is a certain percentage of the fair market value that is determined by local assessors to be the total taxable value of land and additions on the property. | Land | Improvement |
|---|---|---|---|---|
| 2025 | $5,257 | $23,000 | $5,280 | $17,720 |
| 2024 | $5,257 | $19,000 | $4,576 | $14,424 |
| 2023 | $4,980 | $19,000 | $4,576 | $14,424 |
| 2022 | $4,980 | $19,000 | $4,576 | $14,424 |
| 2021 | $4,628 | $15,822 | $3,520 | $12,302 |
| 2020 | $4,912 | $16,713 | $3,520 | $13,193 |
| 2019 | $5,009 | $18,716 | $3,520 | $15,196 |
| 2018 | $4,487 | $15,731 | $2,992 | $12,739 |
| 2017 | $4,417 | $15,731 | $2,992 | $12,739 |
| 2016 | $4,415 | $15,731 | $2,992 | $12,739 |
| 2015 | $4,513 | $15,290 | $2,640 | $12,650 |
| 2014 | $4,422 | $15,290 | $2,640 | $12,650 |
| 2013 | $4,063 | $15,290 | $2,640 | $12,650 |
Source: Public Records
Map
Nearby Homes
- 372 Nancy Ln
- 454 Stone Place
- 115 E Dundee Rd Unit 3N
- 121 Commons Ct Unit 21
- 100 Deborah Ln Unit A19
- 100 Deborah Ln Unit B26
- 100 Deborah Ln Unit 16A
- 241 S Milwaukee Ave
- 468 Harmony Dr Unit 4
- 127 N Wolf Rd Unit 60A
- 190 N Milwaukee Ave Unit 3604
- 375 Plum Creek Dr Unit 412
- 375 Plum Creek Dr Unit G108
- 375 Plum Creek Dr Unit 501
- 195 7th St
- 246 Shadowbend Dr
- 302 Linden Ln
- 292 Shadowbend Dr Unit 3C
- 270 Violet Ln
- 200 Violet Ln
- 70 E Jeffery Ave
- 60 E Jeffery Ave
- 91 E Jeffery Ave
- 85 E Jeffery Ave
- 75 E Jeffery Ave
- 52 E Jeffery Ave
- 360 S Wolf Rd
- 371 Meadowbrook Ln
- 285 S Wolf Rd
- 55 E Jeffery Ave
- 55 E Jeffery Ave Unit House
- 55 E Jeffery Ave Unit esuoH
- 42 E Jeffery Ave
- 377 Meadowbrook Ln
- 366 S Wolf Rd
- 297 S Wolf Rd
- 370 Meadowbrook Ln Unit 1
- 41 E Jeffery Ave
- 385 Meadowbrook Ln
- 34 E Jeffery Ave
Your Personal Tour Guide
Ask me questions while you tour the home.