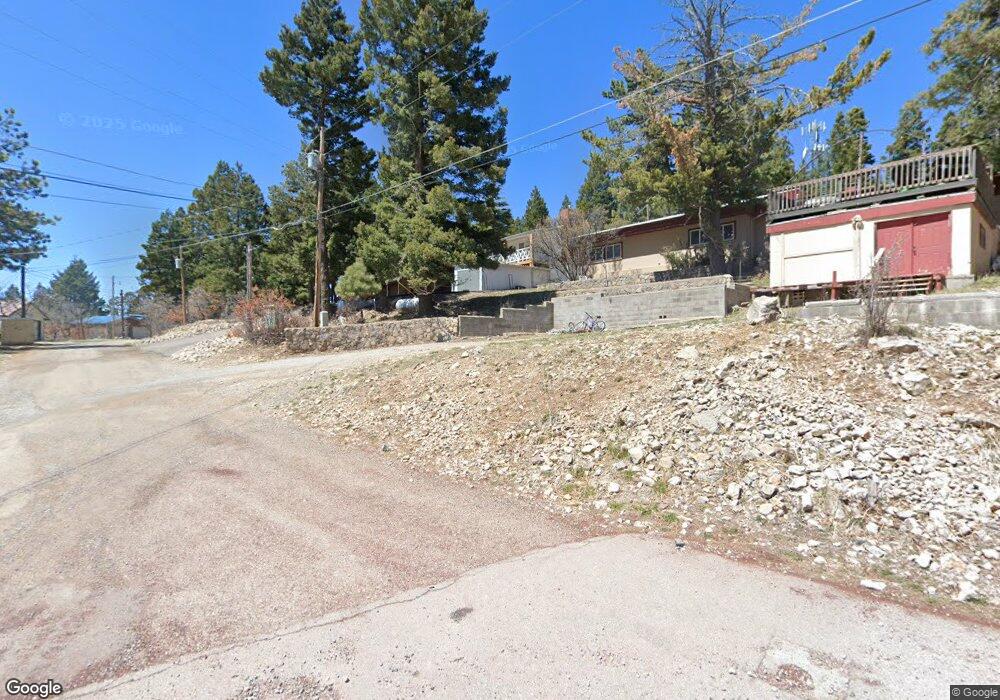
800 Geronimo St Unit 2 Cloudcroft, NM 88317
Estimated Value: $241,000 - $329,000
2
Beds
1
Bath
832
Sq Ft
$351/Sq Ft
Est. Value
About This Home
This home is located at 800 Geronimo St Unit 2, Cloudcroft, NM 88317 and is currently estimated at $292,093, approximately $351 per square foot. 800 Geronimo St Unit 2 is a home located in Otero County with nearby schools including Cloudcroft Elementary School, Cloudcroft Middle School, and Cloudcroft High School.
Ownership History
Date
Name
Owned For
Owner Type
Purchase Details
Closed on
Jul 3, 2023
Sold by
Hancock Johnice G
Bought by
Fyock Wyatt K
Current Estimated Value
Home Financials for this Owner
Home Financials are based on the most recent Mortgage that was taken out on this home.
Original Mortgage
$165,000
Outstanding Balance
$160,235
Interest Rate
6.39%
Mortgage Type
New Conventional
Estimated Equity
$131,858
Purchase Details
Closed on
May 14, 2018
Sold by
Adamek David V and Adamek Susan J
Bought by
Hancock Johnice G
Home Financials for this Owner
Home Financials are based on the most recent Mortgage that was taken out on this home.
Original Mortgage
$104,000
Interest Rate
4.44%
Mortgage Type
New Conventional
Purchase Details
Closed on
Jun 4, 2010
Sold by
Bunner Mark A
Bought by
Adamek David and Adamek Susan J
Purchase Details
Closed on
Feb 18, 2005
Sold by
Hiller James R
Bought by
Bunner Mark A
Create a Home Valuation Report for This Property
The Home Valuation Report is an in-depth analysis detailing your home's value as well as a comparison with similar homes in the area
Purchase History
| Date | Buyer | Sale Price | Title Company |
|---|---|---|---|
| Fyock Wyatt K | -- | Casa Y Tierra Abstract & Title | |
| Hancock Johnice G | -- | Casa Y Tierra Abstract And T | |
| Adamek David | -- | None Available | |
| Bunner Mark A | -- | None Available |
Source: Public Records
Mortgage History
| Date | Status | Borrower | Loan Amount |
|---|---|---|---|
| Open | Fyock Wyatt K | $165,000 | |
| Previous Owner | Hancock Johnice G | $104,000 |
Source: Public Records
Tax History
| Year | Tax Paid | Tax Assessment Tax Assessment Total Assessment is a certain percentage of the fair market value that is determined by local assessors to be the total taxable value of land and additions on the property. | Land | Improvement |
|---|---|---|---|---|
| 2025 | $1,537 | $94,473 | $28,333 | $66,140 |
| 2024 | $1,521 | $93,268 | $28,333 | $64,935 |
| 2023 | $652 | $41,208 | $5,666 | $35,542 |
| 2022 | $655 | $41,208 | $5,666 | $35,542 |
| 2021 | $660 | $41,208 | $5,666 | $35,542 |
| 2020 | $660 | $41,208 | $5,666 | $35,542 |
| 2019 | $682 | $40,400 | $5,555 | $34,845 |
| 2018 | $452 | $27,188 | $5,357 | $21,828 |
| 2017 | $440 | $26,655 | $5,252 | $21,400 |
| 2016 | $435 | $26,133 | $0 | $0 |
| 2015 | $431 | $25,620 | $0 | $0 |
| 2014 | -- | $25,119 | $4,950 | $20,169 |
Source: Public Records
Map
Nearby Homes
- Lot 4 James Canyon Hwy Unit 4
- Lot 3 James Canyon Hwy Unit 3
- 305 Chipmunk Ave
- 1202 Geronimo St
- 204 Squirrel Ave Unit 12,13
- 204 Squirrel Ave
- 0 New Mexico 130 Unit 171184
- 106 Coyote Ave
- 407 Phelps Cir
- 00 Wren Place
- 200 Aspen Cir
- 1001 Ponderosa Place
- 808 Squirrel Ave
- 307 Lynx Ave
- 801 Panther Ave
- 302 Aspen Cir
- 1 Eagle Place
- 1210 Chautauqua Canyon Blvd
- 500 Chautauqua Canyon Blvd
- 810 Sugar Pine Dr
- 800 Geronimo St
- 708 Geronimo St
- 708 Geronimo St Unit 2
- 800 Geronimo St Unit 2
- 802 Geronimo St Unit 2
- 704 Geronimo St
- 806 Geronimo St
- 803 Nyuca Ave Unit 2
- 801 Geronimo St
- 709 Geronimo St
- 805 Nyuca Ave
- 705 Geronimo St
- 708 Victoria St
- 900 Nyuca Ave
- 900 Nyuca Ave Unit 2
- 902 Geronimo St
- 802 Victoria St Unit 14+
- 802 Victoria St
- 802 Victoria St Unit 1A,13
- 701 Geronimo St Unit 2
Your Personal Tour Guide
Ask me questions while you tour the home.