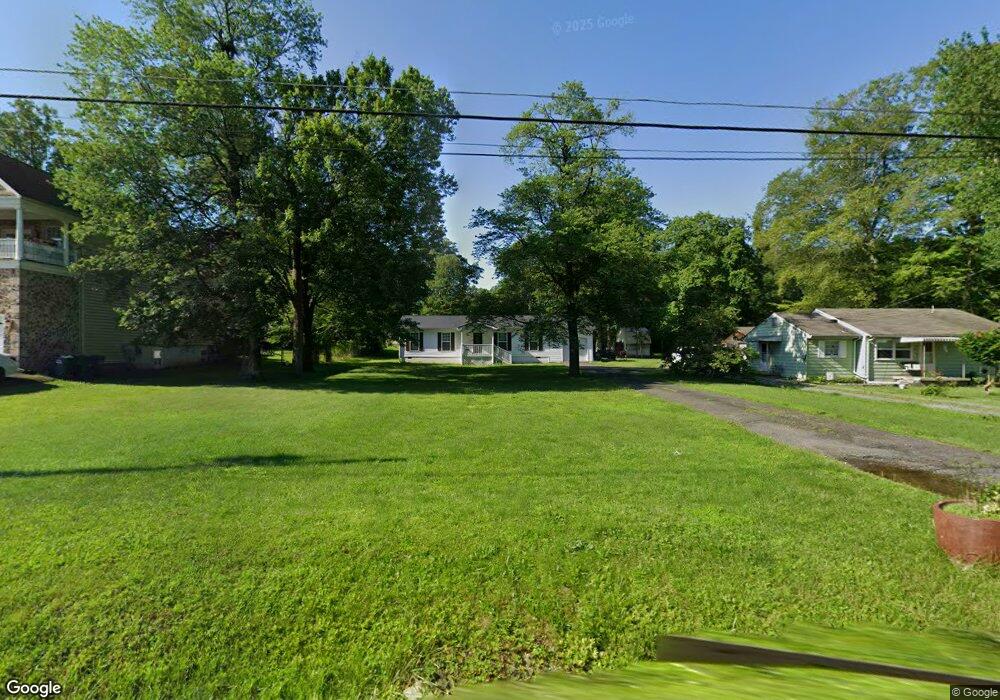
8003 Leland Rd Manassas, VA 20111
Estimated Value: $485,821 - $529,000
3
Beds
2
Baths
1,344
Sq Ft
$377/Sq Ft
Est. Value
About This Home
This home is located at 8003 Leland Rd, Manassas, VA 20111 and is currently estimated at $506,205, approximately $376 per square foot. 8003 Leland Rd is a home located in Prince William County with nearby schools including Yorkshire Elementary School, Parkside Middle School, and Osbourn Park High School.
Ownership History
Date
Name
Owned For
Owner Type
Purchase Details
Closed on
Mar 25, 2002
Sold by
Martinez Morena
Bought by
Castillo Sijifredo and Castillo Castillo,Palmira
Current Estimated Value
Home Financials for this Owner
Home Financials are based on the most recent Mortgage that was taken out on this home.
Original Mortgage
$167,200
Outstanding Balance
$69,106
Interest Rate
6.91%
Mortgage Type
New Conventional
Estimated Equity
$437,099
Purchase Details
Closed on
Sep 24, 1999
Sold by
Secty Of Veterans Affairs
Bought by
Martinez Morena M
Home Financials for this Owner
Home Financials are based on the most recent Mortgage that was taken out on this home.
Original Mortgage
$138,000
Interest Rate
8.1%
Purchase Details
Closed on
Oct 30, 1996
Sold by
Pullen Jeffrey R
Bought by
Hrabak Gary and Hrabak Rhonda K
Home Financials for this Owner
Home Financials are based on the most recent Mortgage that was taken out on this home.
Original Mortgage
$132,600
Interest Rate
8.07%
Mortgage Type
VA
Create a Home Valuation Report for This Property
The Home Valuation Report is an in-depth analysis detailing your home's value as well as a comparison with similar homes in the area
Home Values in the Area
Average Home Value in this Area
Purchase History
| Date | Buyer | Sale Price | Title Company |
|---|---|---|---|
| Castillo Sijifredo | $209,000 | -- | |
| Martinez Morena M | $138,000 | -- | |
| Hrabak Gary | $130,000 | -- |
Source: Public Records
Mortgage History
| Date | Status | Borrower | Loan Amount |
|---|---|---|---|
| Open | Castillo Sijifredo | $167,200 | |
| Previous Owner | Martinez Morena M | $138,000 | |
| Previous Owner | Hrabak Gary | $132,600 |
Source: Public Records
Tax History Compared to Growth
Tax History
| Year | Tax Paid | Tax Assessment Tax Assessment Total Assessment is a certain percentage of the fair market value that is determined by local assessors to be the total taxable value of land and additions on the property. | Land | Improvement |
|---|---|---|---|---|
| 2025 | $3,999 | $425,400 | $141,400 | $284,000 |
| 2024 | $3,999 | $402,100 | $130,200 | $271,900 |
| 2023 | $3,934 | $378,100 | $114,800 | $263,300 |
| 2022 | $4,018 | $352,500 | $112,200 | $240,300 |
| 2021 | $3,834 | $311,000 | $102,000 | $209,000 |
| 2020 | $4,444 | $286,700 | $102,000 | $184,700 |
| 2019 | $4,394 | $283,500 | $101,700 | $181,800 |
| 2018 | $3,322 | $275,100 | $101,700 | $173,400 |
| 2017 | $3,352 | $268,700 | $101,700 | $167,000 |
| 2016 | $3,034 | $244,700 | $101,700 | $143,000 |
| 2015 | $2,654 | $226,100 | $94,900 | $131,200 |
| 2014 | $2,654 | $208,500 | $76,200 | $132,300 |
Source: Public Records
Map
Nearby Homes
- 7923 Maplewood Dr
- 7822 Oak St
- 7712 Pine St
- 8111 Oak St
- 7819 Lake Dr
- 8117 Leland Rd
- 7823 Lake Dr
- 7643 Chestnut St
- 8118 Rugby Rd
- 504 Tassita Ln
- 7421 Lake Dr
- 7362 Riding Meadow Way
- 8006 Well St
- 8239 Glade Bank Dr
- 8321 Maplewood Dr
- 8319 Leighlex Ct
- 8401 Yorkshire Ln
- 8020 Towering Oak Way
- 7641 Chadds Landing Way
- 7555 Kimberton Ct
- 7934 Maplewood Dr
- 7930 Maplewood Dr
- 8005 Leland Rd
- 7938 Maplewood Dr
- 8007 Leland Rd
- 7940 Maplewood Dr
- 7929 Maplewood Dr
- 8009 Leland Rd
- 7996 Leland Rd
- 7942 Maplewood Dr
- 8000 Leland Rd
- 7992 Leland Rd
- 7823 Leland Rd
- 8004 Leland Rd
- 7941 Maplewood Dr
- 7944 Maplewood Dr
- 8011 Leland Rd
- 8013 Leland Rd
- 8004 Oak St
- 7821 Leland Rd