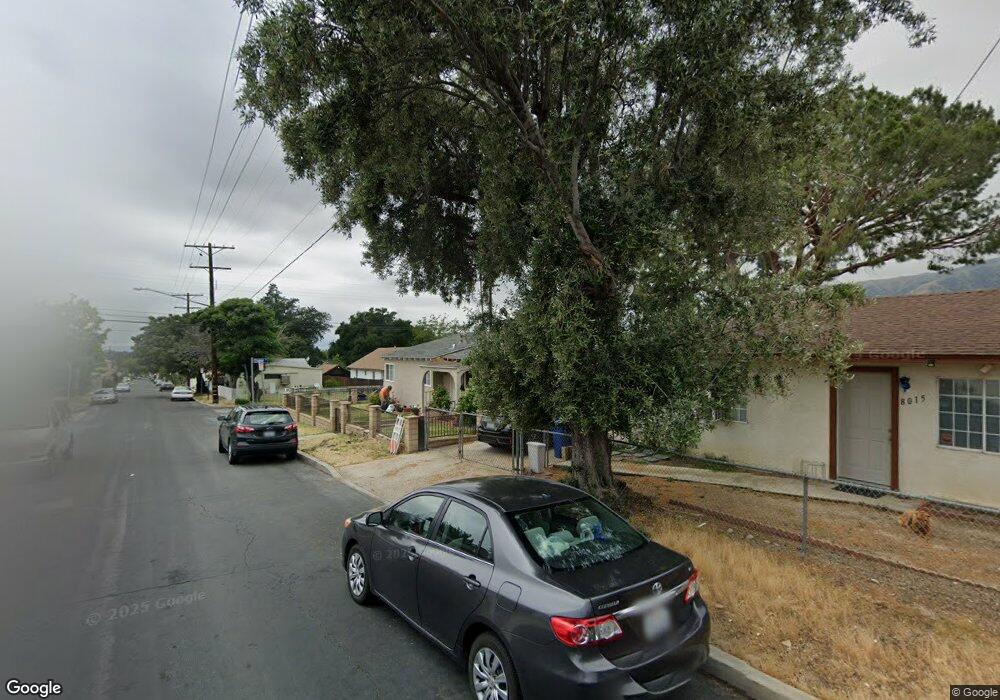
8019 Fenwick St Sunland, CA 91040
Sunland NeighborhoodEstimated Value: $766,000 - $839,000
3
Beds
2
Baths
1,210
Sq Ft
$663/Sq Ft
Est. Value
About This Home
This home is located at 8019 Fenwick St, Sunland, CA 91040 and is currently estimated at $801,808, approximately $662 per square foot. 8019 Fenwick St is a home located in Los Angeles County with nearby schools including Sunland Elementary School, Mt. Gleason Middle School, and Verdugo Hills Senior High School.
Ownership History
Date
Name
Owned For
Owner Type
Purchase Details
Closed on
Mar 12, 2025
Sold by
Vidaurre Mirna Y and Ramirez Mirna Y
Bought by
Vidaurre Guillermo
Current Estimated Value
Purchase Details
Closed on
Jun 5, 1995
Sold by
Brown Lawrence H and Brown Barbara J
Bought by
Vidaurre Guillermo
Home Financials for this Owner
Home Financials are based on the most recent Mortgage that was taken out on this home.
Original Mortgage
$134,900
Interest Rate
7.9%
Create a Home Valuation Report for This Property
The Home Valuation Report is an in-depth analysis detailing your home's value as well as a comparison with similar homes in the area
Home Values in the Area
Average Home Value in this Area
Purchase History
| Date | Buyer | Sale Price | Title Company |
|---|---|---|---|
| Vidaurre Guillermo | -- | Chicago Title Company | |
| Vidaurre Guillermo | $142,000 | -- |
Source: Public Records
Mortgage History
| Date | Status | Borrower | Loan Amount |
|---|---|---|---|
| Previous Owner | Vidaurre Guillermo | $134,900 |
Source: Public Records
Tax History Compared to Growth
Tax History
| Year | Tax Paid | Tax Assessment Tax Assessment Total Assessment is a certain percentage of the fair market value that is determined by local assessors to be the total taxable value of land and additions on the property. | Land | Improvement |
|---|---|---|---|---|
| 2025 | $2,980 | $235,869 | $122,751 | $113,118 |
| 2024 | $2,980 | $231,245 | $120,345 | $110,900 |
| 2023 | $2,925 | $226,712 | $117,986 | $108,726 |
| 2022 | $2,791 | $222,268 | $115,673 | $106,595 |
| 2021 | $2,752 | $217,910 | $113,405 | $104,505 |
| 2019 | $2,672 | $211,449 | $110,043 | $101,406 |
| 2018 | $2,626 | $207,304 | $107,886 | $99,418 |
| 2016 | $2,499 | $199,256 | $103,698 | $95,558 |
| 2015 | $2,464 | $196,264 | $102,141 | $94,123 |
| 2014 | $2,480 | $192,421 | $100,141 | $92,280 |
Source: Public Records
Map
Nearby Homes
- 10623 Woodward Ave
- 7851 Fenwick St
- 10430 Mcvine Ave
- 8230 Hillrose St
- 10429 Mcvine Ave
- 10404 Leolang Ave
- 10529 Mount Gleason Ave
- 10415 Mcvine Ave Unit 2
- 10414 Whitegate Ave
- 10404 Jardine Ave
- 7961 Apperson St
- 7848 Forsythe St
- 10300 Whitegate Ave
- 10704 Oro Vista Ave
- 7755 Forsythe St
- 7961 Day St
- 8421 Grenoble St
- 8352 Wyngate St
- 8110 Brownstone St
- 10335 Oro Vista Ave
- 8015 Fenwick St
- 10610 Rhodesia Ave
- 10558 Rhodesia Ave
- 10614 Rhodesia Ave
- 8035 Fenwick St
- 10607 Rhodesia Ave
- 10603 Woodward Ave
- 10611 Rhodesia Ave
- 10611 Woodward Ave
- 10554 Rhodesia Ave
- 10615 Rhodesia Ave
- 10559 Rhodesia Ave
- 10615 Woodward Ave
- 10555 Woodward Ave
- 10622 Rhodesia Ave
- 10550 Rhodesia Ave
- 10619 Rhodesia Ave
- 10555 Rhodesia Ave
- 10619 Woodward Ave
- 10553 Woodward Ave