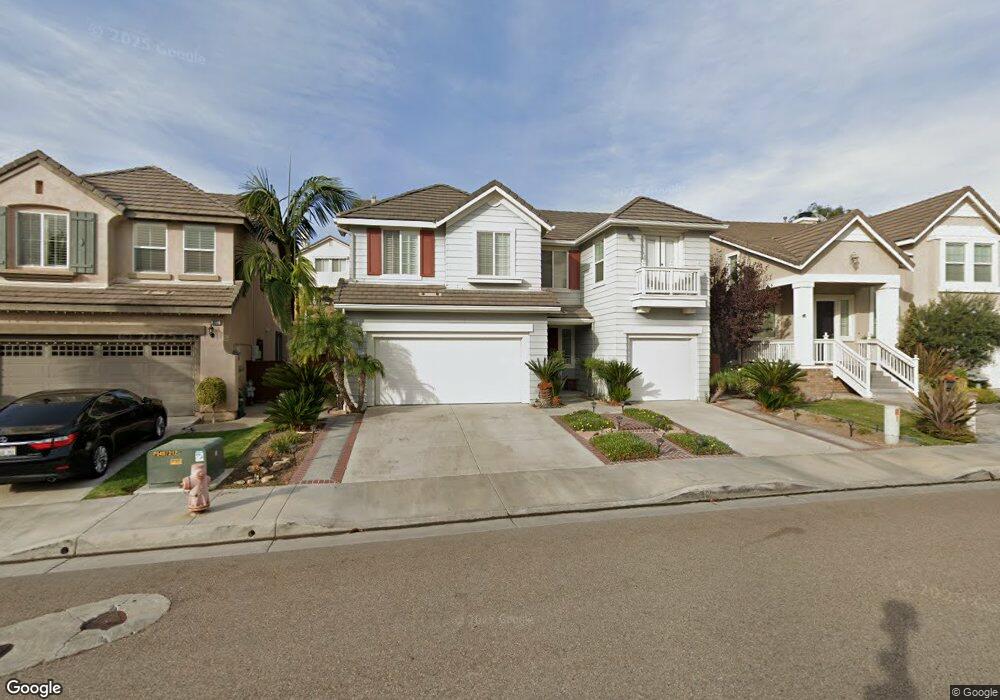
8023 E Hampshire Rd Orange, CA 92867
Estimated Value: $1,502,425 - $1,725,000
4
Beds
3
Baths
2,984
Sq Ft
$539/Sq Ft
Est. Value
About This Home
This home is located at 8023 E Hampshire Rd, Orange, CA 92867 and is currently estimated at $1,608,356, approximately $538 per square foot. 8023 E Hampshire Rd is a home located in Orange County with nearby schools including Anaheim Hills Elementary School, Canyon High School, and El Rancho Charter.
Ownership History
Date
Name
Owned For
Owner Type
Purchase Details
Closed on
Nov 30, 2020
Sold by
Thompson Randy G and Thompson Janrose
Bought by
Thompson Randy G and Thompson Janrose
Current Estimated Value
Home Financials for this Owner
Home Financials are based on the most recent Mortgage that was taken out on this home.
Original Mortgage
$390,000
Outstanding Balance
$347,835
Interest Rate
2.8%
Mortgage Type
New Conventional
Estimated Equity
$1,260,521
Purchase Details
Closed on
Aug 21, 2013
Sold by
Thompson Randy G and Thompso Janrose
Bought by
Thompson Randy G and Thompson Janrose
Purchase Details
Closed on
Aug 14, 2002
Sold by
Pulte Home Corp
Bought by
Thompson Randy and Thompson Janrose
Home Financials for this Owner
Home Financials are based on the most recent Mortgage that was taken out on this home.
Original Mortgage
$300,700
Interest Rate
5.99%
Create a Home Valuation Report for This Property
The Home Valuation Report is an in-depth analysis detailing your home's value as well as a comparison with similar homes in the area
Home Values in the Area
Average Home Value in this Area
Purchase History
| Date | Buyer | Sale Price | Title Company |
|---|---|---|---|
| Thompson Randy G | -- | First American Title Company | |
| Thompson Randy G | -- | First American Title Company | |
| Thompson Randy G | -- | None Available | |
| Thompson Randy | $494,500 | First American Title Co |
Source: Public Records
Mortgage History
| Date | Status | Borrower | Loan Amount |
|---|---|---|---|
| Open | Thompson Randy G | $390,000 | |
| Previous Owner | Thompson Randy | $300,700 |
Source: Public Records
Tax History
| Year | Tax Paid | Tax Assessment Tax Assessment Total Assessment is a certain percentage of the fair market value that is determined by local assessors to be the total taxable value of land and additions on the property. | Land | Improvement |
|---|---|---|---|---|
| 2025 | $10,228 | $737,444 | $283,547 | $453,897 |
| 2024 | $10,228 | $722,985 | $277,987 | $444,998 |
| 2023 | $10,005 | $708,809 | $272,536 | $436,273 |
| 2022 | $9,796 | $694,911 | $267,192 | $427,719 |
| 2021 | $10,069 | $681,286 | $261,953 | $419,333 |
| 2020 | $9,946 | $674,301 | $259,267 | $415,034 |
| 2019 | $9,787 | $661,080 | $254,183 | $406,897 |
| 2018 | $9,617 | $648,118 | $249,199 | $398,919 |
| 2017 | $9,256 | $635,410 | $244,312 | $391,098 |
| 2016 | $9,062 | $622,951 | $239,521 | $383,430 |
| 2015 | $8,886 | $613,594 | $235,923 | $377,671 |
| 2014 | $8,684 | $601,575 | $231,302 | $370,273 |
Source: Public Records
Map
Nearby Homes
- 2589 N Promontory Way
- 847 S Amber Ln
- 2463 N Eaton Ct
- 8415 E Kendra Loop
- 6520 E Paseo el Greco
- 731 S Ridgeview Rd
- 730 S Stillwater Ln
- 720 S Ridgeview Rd
- 6508 E Marengo Dr
- 6547 E Marengo Dr
- 783 S Ruby Ln
- 6201 E Onyx Ln
- 868 S Calle Venado
- 6512 E Camino Vista Unit 6
- 6624 E Leafwood Dr
- 6515 E Circulo Dali
- 6595 E Paseo Murillo
- 6691 E Smokewood Cir
- 6525 E Camino Vista
- 7817 E Sandberg Ln
- 8035 E Hampshire Rd
- 8011 E Hampshire Rd
- 8026 E Portico Terrace
- 7985 E Hampshire Rd
- 8012 E Portico Terrace
- 8034 E Portico Terrace
- 7968 E Portico Terrace
- 8059 E Hampshire Rd
- 8028 E Hampshire Rd
- 7973 E Hampshire Rd
- 8016 E Hampshire Rd
- 8034 E Hampshire Rd
- 8048 E Portico Terrace
- 7952 E Portico Terrace
- 7986 E Hampshire Rd
- 8046 E Hampshire Rd
- 8061 E Hampshire Rd
- 7961 E Hampshire Rd
- 8052 E Portico Terrace
- 8052 E Hampshire Rd
Your Personal Tour Guide
Ask me questions while you tour the home.