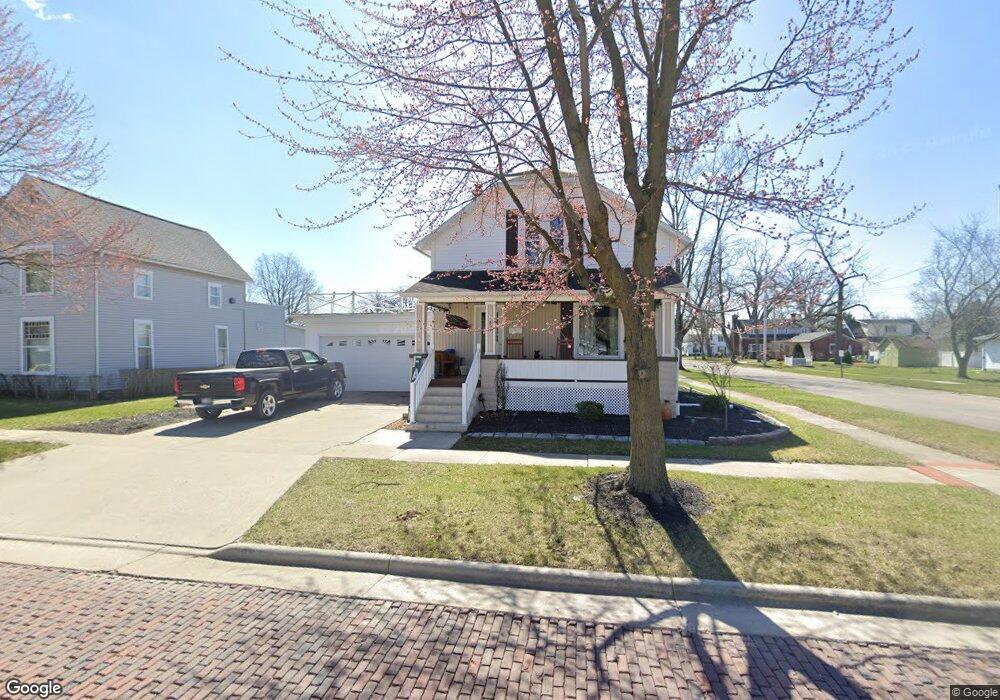
804 E 3rd St Ottawa, OH 45875
Estimated Value: $150,471 - $202,000
3
Beds
2
Baths
1,560
Sq Ft
$109/Sq Ft
Est. Value
About This Home
This home is located at 804 E 3rd St, Ottawa, OH 45875 and is currently estimated at $169,618, approximately $108 per square foot. 804 E 3rd St is a home located in Putnam County with nearby schools including Ottawa-Glandorf High School and Sts. Peter & Paul Catholic School.
Ownership History
Date
Name
Owned For
Owner Type
Purchase Details
Closed on
May 1, 2017
Sold by
Kuhlman Debra L and Morman William R
Bought by
Kuhlman Anthony and Kuhlman Cheryl
Current Estimated Value
Purchase Details
Closed on
Apr 26, 2017
Sold by
Smith Amy S
Bought by
Kuhlman Anthony and Kuhlman Cheryl
Purchase Details
Closed on
Mar 18, 2016
Sold by
Estate Of Stephen P Morman
Bought by
Morman Patricia A
Purchase Details
Closed on
Nov 16, 2012
Sold by
Morman Irene
Bought by
Morman Stephen P and Kuhlman Debra L
Purchase Details
Closed on
Feb 8, 2005
Sold by
Morman Paul and Morman Irene
Bought by
Morman Stephen P and Morman Debra L
Purchase Details
Closed on
Sep 5, 2002
Bought by
Morman Stephen P
Create a Home Valuation Report for This Property
The Home Valuation Report is an in-depth analysis detailing your home's value as well as a comparison with similar homes in the area
Home Values in the Area
Average Home Value in this Area
Purchase History
| Date | Buyer | Sale Price | Title Company |
|---|---|---|---|
| Kuhlman Anthony | $68,600 | Attorney | |
| Kuhlman Anthony | $11,500 | Attorney | |
| Morman Patricia A | -- | None Available | |
| Morman Stephen P | -- | Attorney | |
| Morman Stephen P | -- | None Available | |
| Morman Stephen P | -- | -- |
Source: Public Records
Tax History
| Year | Tax Paid | Tax Assessment Tax Assessment Total Assessment is a certain percentage of the fair market value that is determined by local assessors to be the total taxable value of land and additions on the property. | Land | Improvement |
|---|---|---|---|---|
| 2025 | $1,206 | $35,330 | $3,080 | $32,250 |
| 2024 | $1,124 | $35,330 | $3,080 | $32,250 |
| 2023 | $1,181 | $27,700 | $2,380 | $25,320 |
| 2022 | $1,050 | $27,699 | $2,380 | $25,319 |
| 2021 | $1,052 | $27,620 | $2,380 | $25,240 |
| 2020 | $1,058 | $25,140 | $2,100 | $23,040 |
| 2019 | $947 | $24,640 | $2,380 | $22,260 |
| 2018 | $906 | $24,640 | $2,380 | $22,260 |
| 2017 | $940 | $24,640 | $2,380 | $22,260 |
| 2016 | $939 | $25,140 | $2,100 | $23,040 |
| 2015 | $946 | $25,140 | $2,100 | $23,040 |
| 2014 | $934 | $25,140 | $2,100 | $23,040 |
| 2013 | $931 | $25,140 | $2,100 | $23,040 |
Source: Public Records
Map
Nearby Homes
- 740 E Main St
- 717 E 2nd St
- 370 S Thomas St
- 238 N Ohio Ave
- 1535 E 3rd St
- 715 N Perry St
- 1731 S Agner St
- 0 Sapphire St Unit 225029940
- 0 Sapphire St Unit 225046385
- 1823 S Agner St
- 717 & 717 1/2 & 721 E Third St
- 1997 E Main St
- 309 Oakview Dr
- 113 Crabapple Ln
- 331 Chippewa Dr
- 9896 Road M
- 9410 Road H
- 12806 Road K
- 5666 State Route 224
- 13592 Ohio 694
Your Personal Tour Guide
Ask me questions while you tour the home.