804 Elm St Bay City, MI 48706
Estimated Value: $88,000 - $108,000
2
Beds
1
Bath
720
Sq Ft
$135/Sq Ft
Est. Value
About This Home
This home is located at 804 Elm St, Bay City, MI 48706 and is currently estimated at $97,125, approximately $134 per square foot. 804 Elm St is a home located in Bay County with nearby schools including Linsday Elementary School, Handy Middle School, and Bay City Central High School.
Ownership History
Date
Name
Owned For
Owner Type
Purchase Details
Closed on
Nov 16, 2007
Sold by
Kiesel Priscilla A
Bought by
Smith Dana R E
Current Estimated Value
Home Financials for this Owner
Home Financials are based on the most recent Mortgage that was taken out on this home.
Original Mortgage
$64,490
Outstanding Balance
$40,656
Interest Rate
6.31%
Mortgage Type
FHA
Estimated Equity
$56,469
Purchase Details
Closed on
Aug 1, 1987
Sold by
Socia Kevin and Socia Corrine M
Bought by
Young Dale and Young Irene I
Create a Home Valuation Report for This Property
The Home Valuation Report is an in-depth analysis detailing your home's value as well as a comparison with similar homes in the area
Home Values in the Area
Average Home Value in this Area
Purchase History
| Date | Buyer | Sale Price | Title Company |
|---|---|---|---|
| Smith Dana R E | $65,000 | None Available | |
| Young Dale | $21,000 | -- |
Source: Public Records
Mortgage History
| Date | Status | Borrower | Loan Amount |
|---|---|---|---|
| Open | Smith Dana R E | $64,490 |
Source: Public Records
Tax History Compared to Growth
Tax History
| Year | Tax Paid | Tax Assessment Tax Assessment Total Assessment is a certain percentage of the fair market value that is determined by local assessors to be the total taxable value of land and additions on the property. | Land | Improvement |
|---|---|---|---|---|
| 2025 | $1,156 | $39,450 | $0 | $0 |
| 2024 | $951 | $34,850 | $0 | $0 |
| 2023 | $906 | $30,150 | $0 | $0 |
| 2022 | $1,040 | $27,550 | $0 | $0 |
| 2021 | $978 | $25,950 | $25,950 | $0 |
| 2020 | $1,040 | $23,000 | $23,000 | $0 |
| 2019 | $1,018 | $22,150 | $0 | $0 |
| 2018 | $1,007 | $22,200 | $0 | $0 |
| 2017 | $985 | $21,950 | $0 | $0 |
| 2016 | $980 | $22,100 | $0 | $22,100 |
| 2015 | $1,008 | $19,850 | $0 | $19,850 |
| 2014 | $1,008 | $20,750 | $0 | $20,750 |
Source: Public Records
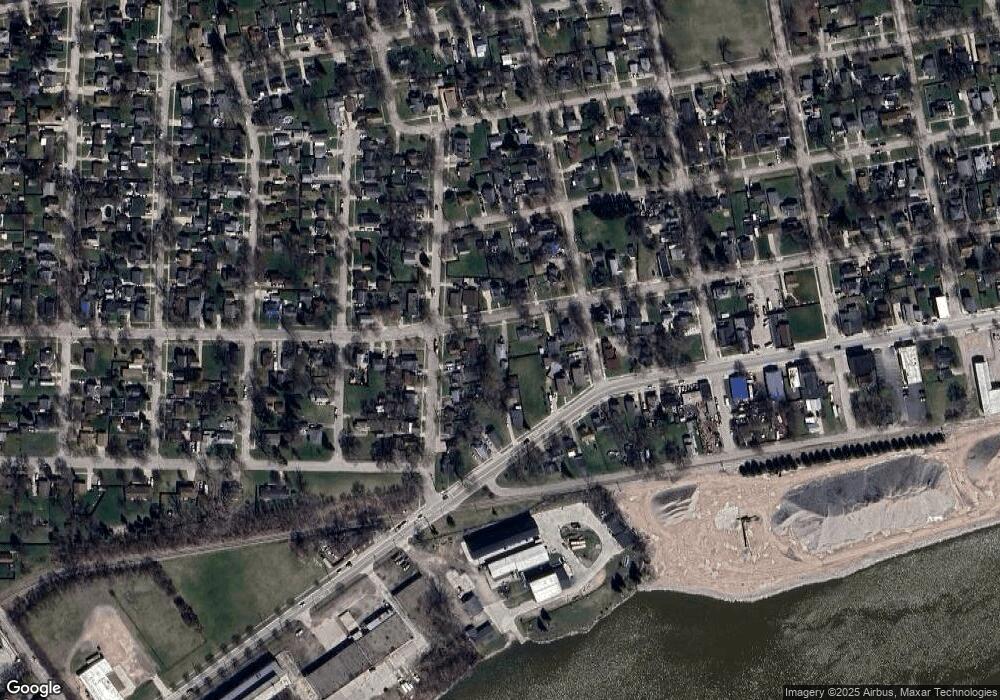
Map
Nearby Homes