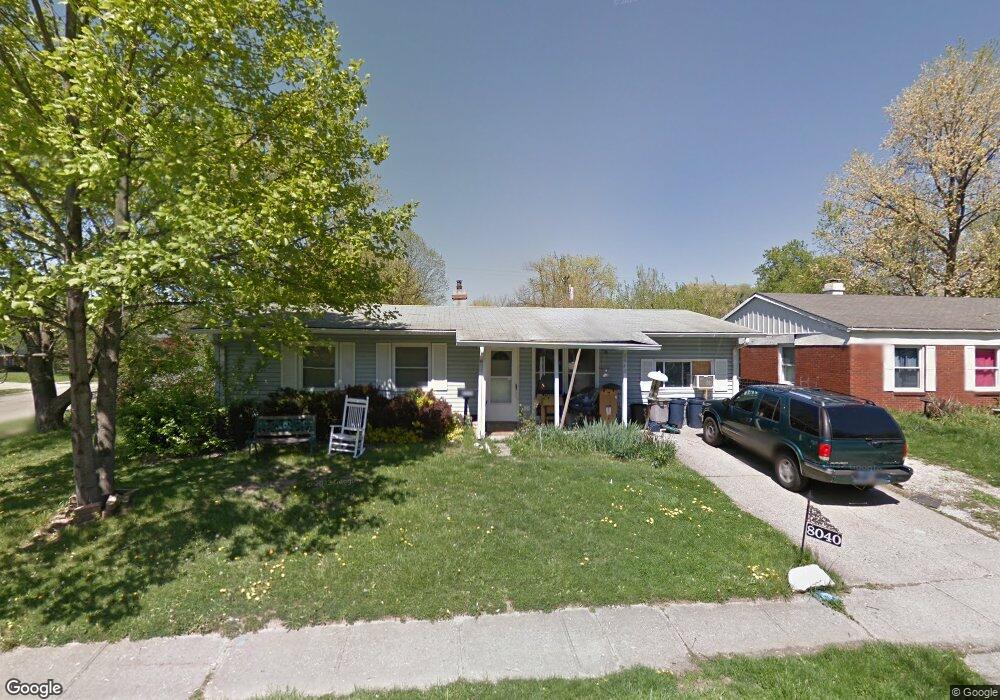
8040 Laughlin Dr Indianapolis, IN 46219
Far Eastside NeighborhoodEstimated Value: $157,905 - $182,000
3
Beds
2
Baths
1,543
Sq Ft
$111/Sq Ft
Est. Value
About This Home
This home is located at 8040 Laughlin Dr, Indianapolis, IN 46219 and is currently estimated at $170,726, approximately $110 per square foot. 8040 Laughlin Dr is a home located in Marion County with nearby schools including Thomas D. Gregg School No. 15, Washington Irving School 14, and Anna Brochhausen School 88.
Ownership History
Date
Name
Owned For
Owner Type
Purchase Details
Closed on
May 27, 2014
Sold by
Breaux Billie
Bought by
Hoosier Collins Commercial Strategies Ll
Current Estimated Value
Purchase Details
Closed on
Oct 3, 2013
Sold by
Sonntag John
Purchase Details
Closed on
Sep 27, 2013
Sold by
Sonntag S John D
Bought by
Indy Funds Inc
Purchase Details
Closed on
Feb 8, 2006
Sold by
Sonntag John
Bought by
Sonntag John and Sonntag Amanda Magdalinos
Home Financials for this Owner
Home Financials are based on the most recent Mortgage that was taken out on this home.
Original Mortgage
$69,300
Interest Rate
8.5%
Mortgage Type
Adjustable Rate Mortgage/ARM
Purchase Details
Closed on
Feb 3, 2006
Sold by
Laughlin Carl F
Bought by
Sonntag John
Home Financials for this Owner
Home Financials are based on the most recent Mortgage that was taken out on this home.
Original Mortgage
$69,300
Interest Rate
8.5%
Mortgage Type
Adjustable Rate Mortgage/ARM
Create a Home Valuation Report for This Property
The Home Valuation Report is an in-depth analysis detailing your home's value as well as a comparison with similar homes in the area
Home Values in the Area
Average Home Value in this Area
Purchase History
| Date | Buyer | Sale Price | Title Company |
|---|---|---|---|
| Hoosier Collins Commercial Strategies Ll | $12,500 | Marion County Auditor | |
| Hoosier Collins Commercial Strategies Ll | $12,500 | None Available | |
| -- | $4,200 | -- | |
| Indy Funds Inc | -- | -- | |
| Sonntag John | -- | Superior Title Services Llc | |
| Sonntag John | -- | Superior Title Services Llc |
Source: Public Records
Mortgage History
| Date | Status | Borrower | Loan Amount |
|---|---|---|---|
| Previous Owner | Sonntag John | $69,300 |
Source: Public Records
Tax History
| Year | Tax Paid | Tax Assessment Tax Assessment Total Assessment is a certain percentage of the fair market value that is determined by local assessors to be the total taxable value of land and additions on the property. | Land | Improvement |
|---|---|---|---|---|
| 2024 | $666 | $108,400 | $13,600 | $94,800 |
| 2023 | $666 | $83,900 | $13,600 | $70,300 |
| 2022 | $626 | $75,800 | $13,600 | $62,200 |
| 2021 | $570 | $64,900 | $13,600 | $51,300 |
| 2020 | $579 | $67,000 | $14,300 | $52,700 |
| 2019 | $573 | $65,400 | $14,300 | $51,100 |
| 2018 | $530 | $58,200 | $14,300 | $43,900 |
| 2017 | $468 | $57,600 | $14,300 | $43,300 |
| 2016 | $1,249 | $56,500 | $14,300 | $42,200 |
| 2014 | $1,176 | $54,400 | $14,300 | $40,100 |
| 2013 | $1,245 | $59,900 | $14,300 | $45,600 |
Source: Public Records
Map
Nearby Homes
- 2337 Sickle Rd
- 8212 Laughlin Dr
- 8115 Barry Rd
- 2533 Aurie Dr
- 8319 Wysong Dr
- 2626 Ebbie Rd
- 7803 Wysong Dr
- 7804 E 21st St
- 8801 Roy Rd
- 8532 Palm Ct
- 8757 Routiers Ct
- 1808 Orchid Ct
- 1819 Hibiscus Dr
- 1804 Queensbridge Cir
- 1798 Wellesley Ln
- 2613 N Bazil Ave
- 8222 Forsythia Cir
- 1763 Wellesley Ln Unit 2A
- 2442 Morning Star Dr
- 8128 Forsythia Ct
- 8033 Wysong Dr
- 8041 Wysong Dr
- 8112 Laughlin Dr
- 2402 Sickle Rd
- 2358 Sickle Rd
- 8103 Wysong Dr
- 8111 Laughlin Dr
- 2410 Sickle Rd
- 8118 Laughlin Dr
- 2352 Sickle Rd
- 2349 Sickle Rd
- 8109 Wysong Dr
- 8117 Crousore Rd
- 2346 Sickle Rd
- 2428 Sickle Rd
- 8124 Laughlin Dr
- 8115 Wysong Dr
- 2343 Sickle Rd
- 8044 Wysong Dr
- 2419 N Franklin Rd
Your Personal Tour Guide
Ask me questions while you tour the home.