Estimated Value: $503,000 - $599,000
4
Beds
2
Baths
1,800
Sq Ft
$301/Sq Ft
Est. Value
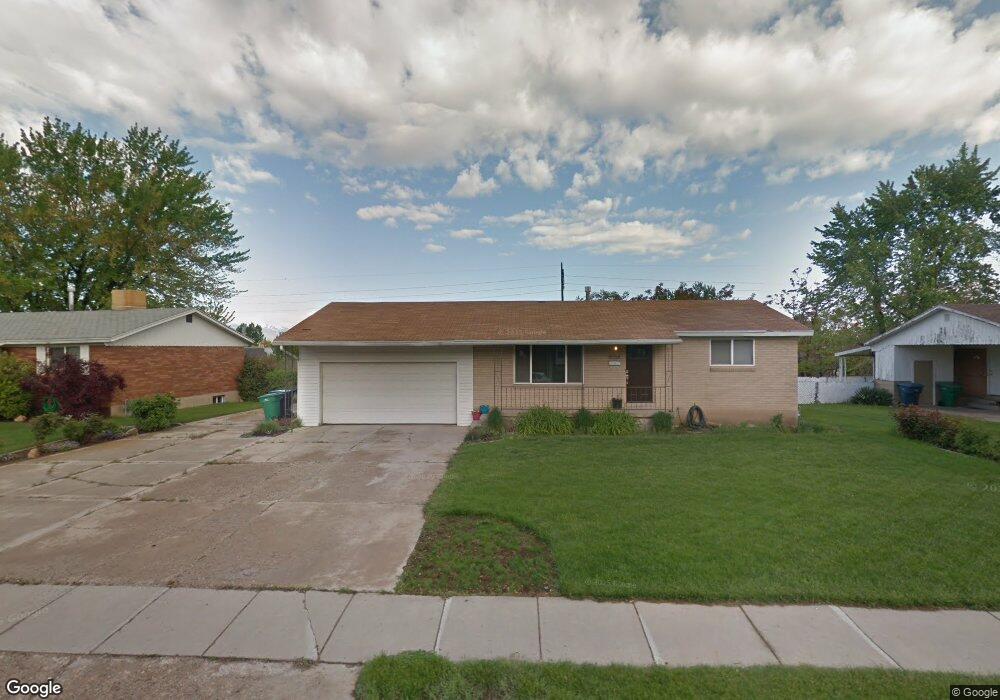
About This Home
This home is located at 8058 Bryce Dr, Sandy, UT 84070 and is currently estimated at $541,567, approximately $300 per square foot. 8058 Bryce Dr is a home located in Salt Lake County with nearby schools including Midvalley Elementary School, Union Middle School, and Hillcrest High School.
Ownership History
Date
Name
Owned For
Owner Type
Purchase Details
Closed on
Aug 11, 2008
Sold by
Clarke Jarrod
Bought by
Raleigh Sean M and Raleigh Kirsti
Current Estimated Value
Home Financials for this Owner
Home Financials are based on the most recent Mortgage that was taken out on this home.
Original Mortgage
$206,755
Outstanding Balance
$136,297
Interest Rate
6.42%
Mortgage Type
FHA
Estimated Equity
$405,270
Purchase Details
Closed on
May 28, 2004
Sold by
Gamingasco Winona
Bought by
Clarke Jarrod
Home Financials for this Owner
Home Financials are based on the most recent Mortgage that was taken out on this home.
Original Mortgage
$125,600
Interest Rate
4.87%
Mortgage Type
Purchase Money Mortgage
Purchase Details
Closed on
Aug 6, 1998
Sold by
Gamingasco A Winona
Bought by
Gamingasco Winona
Create a Home Valuation Report for This Property
The Home Valuation Report is an in-depth analysis detailing your home's value as well as a comparison with similar homes in the area
Home Values in the Area
Average Home Value in this Area
Purchase History
| Date | Buyer | Sale Price | Title Company |
|---|---|---|---|
| Raleigh Sean M | -- | Metro National Title | |
| Clarke Jarrod | -- | Metro National Title | |
| Gamingasco Winona | -- | -- |
Source: Public Records
Mortgage History
| Date | Status | Borrower | Loan Amount |
|---|---|---|---|
| Open | Raleigh Sean M | $206,755 | |
| Previous Owner | Clarke Jarrod | $125,600 |
Source: Public Records
Tax History
| Year | Tax Paid | Tax Assessment Tax Assessment Total Assessment is a certain percentage of the fair market value that is determined by local assessors to be the total taxable value of land and additions on the property. | Land | Improvement |
|---|---|---|---|---|
| 2025 | $2,510 | $469,800 | $128,500 | $341,300 |
| 2024 | $2,510 | $463,700 | $120,800 | $342,900 |
| 2023 | $2,174 | $400,400 | $114,800 | $285,600 |
| 2022 | $2,277 | $410,200 | $112,600 | $297,600 |
| 2021 | $2,046 | $313,200 | $97,900 | $215,300 |
| 2020 | $1,953 | $282,100 | $79,300 | $202,800 |
| 2019 | $1,905 | $268,000 | $79,300 | $188,700 |
| 2016 | $1,620 | $219,200 | $70,500 | $148,700 |
Source: Public Records
Map
Nearby Homes
- 393 E Corral Creek Dr
- 379 E Horse Creek Dr
- 8087 S 615 E
- 8248 S Romaine Dr
- 274 E Water Mill Way Unit 230
- 7914 S Harvel Dr
- 257 Water Mill Way Unit 211
- 257 E Water Mill Way
- 397 E Tractor Dr
- 8260 S 560 E
- 635 E Williamsburg Park Cir
- 8292 S 560 E
- 8322 S Levine Ln Unit 111
- 7824 S 280 E
- 760 E 8080 S
- 8023 S Pinewood Dr
- 8257 S 180 E
- 135 E Station St
- 7738 S Sunbird Way
- 7824 S Sequoia Tree Ln
Your Personal Tour Guide
Ask me questions while you tour the home.