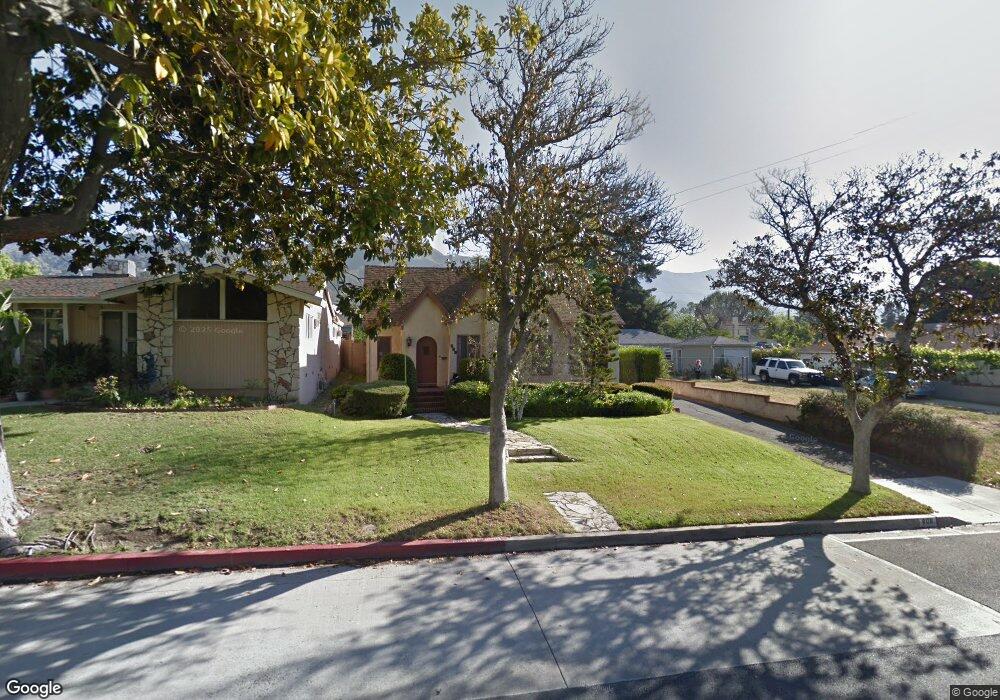
806 S Kenneth Rd Burbank, CA 91501
Hillside District NeighborhoodEstimated Value: $1,466,000 - $1,759,000
5
Beds
3
Baths
1,918
Sq Ft
$822/Sq Ft
Est. Value
About This Home
This home is located at 806 S Kenneth Rd, Burbank, CA 91501 and is currently estimated at $1,576,818, approximately $822 per square foot. 806 S Kenneth Rd is a home located in Los Angeles County with nearby schools including Joaquin Miller Elementary School, John Muir Middle School, and Burbank High School.
Ownership History
Date
Name
Owned For
Owner Type
Purchase Details
Closed on
Sep 9, 2016
Sold by
Sansone Sharon and Sansone Toby
Bought by
Sansone Sharon and Sansone Toby
Current Estimated Value
Home Financials for this Owner
Home Financials are based on the most recent Mortgage that was taken out on this home.
Original Mortgage
$133,000
Interest Rate
3.45%
Mortgage Type
New Conventional
Purchase Details
Closed on
Feb 10, 2016
Sold by
Sansone Tobi
Bought by
Sansone Tobi and Tobi Sansone 2016 Living Trust
Purchase Details
Closed on
Oct 5, 2011
Sold by
Sansone Sharon and Sansone Tobi
Bought by
Sansone Sharon and Sansone Tobi
Home Financials for this Owner
Home Financials are based on the most recent Mortgage that was taken out on this home.
Original Mortgage
$144,500
Interest Rate
4.15%
Mortgage Type
New Conventional
Create a Home Valuation Report for This Property
The Home Valuation Report is an in-depth analysis detailing your home's value as well as a comparison with similar homes in the area
Home Values in the Area
Average Home Value in this Area
Purchase History
| Date | Buyer | Sale Price | Title Company |
|---|---|---|---|
| Sansone Sharon | -- | Accommodation | |
| Sansone Sharon | -- | Lawyers Title Company | |
| Sansone Tobi | -- | None Available | |
| Sansone Sharon | -- | Old Republic Title Co |
Source: Public Records
Mortgage History
| Date | Status | Borrower | Loan Amount |
|---|---|---|---|
| Closed | Sansone Sharon | $133,000 | |
| Closed | Sansone Sharon | $144,500 |
Source: Public Records
Tax History
| Year | Tax Paid | Tax Assessment Tax Assessment Total Assessment is a certain percentage of the fair market value that is determined by local assessors to be the total taxable value of land and additions on the property. | Land | Improvement |
|---|---|---|---|---|
| 2025 | $6,532 | $586,351 | $421,075 | $165,276 |
| 2024 | $6,532 | $574,855 | $412,819 | $162,036 |
| 2023 | $6,463 | $563,584 | $404,725 | $158,859 |
| 2022 | $6,172 | $552,535 | $396,790 | $155,745 |
| 2021 | $6,141 | $541,702 | $389,010 | $152,692 |
| 2019 | $5,894 | $525,637 | $377,473 | $148,164 |
| 2018 | $5,776 | $515,331 | $370,072 | $145,259 |
| 2016 | $5,473 | $495,321 | $355,702 | $139,619 |
| 2015 | $5,362 | $487,882 | $350,360 | $137,522 |
| 2014 | $5,350 | $478,326 | $343,497 | $134,829 |
Source: Public Records
Map
Nearby Homes
- 640 E Elmwood Ave
- 1230 Spazier Ave
- 1023 E Elmwood Ave
- 1911 W Kenneth Rd
- 1362 Linden Ave
- 723 E Tujunga Ave
- 1262 Allen Ave
- 429 E Providencia Ave Unit B
- 828 S Sunset Canyon Dr
- 423 E Providencia Ave
- 1042 E Tujunga Ave
- 326 E Valencia Ave Unit C
- 1135 Allen Ave Unit 20
- 324 E Santa Anita Ave
- 1135 E Verdugo Ave
- 470 E Angeleno Ave
- 1052 Elm Ave
- 615 E Olive Ave Unit A
- 626 E Orange Grove Ave Unit 204
- 1723 Thurber Place
- 810 S Kenneth Rd
- 800 S Kenneth Rd
- 814 E Elmwood Ave
- 814 S Kenneth Rd
- 818 E Elmwood Ave
- 738 E Elmwood Ave
- 739 E Valencia Ave
- 811 E Valencia Ave
- 820 S Kenneth Rd
- 822 E Elmwood Ave
- 809 E Elmwood Ave
- 801 E Elmwood Ave
- 815 E Valencia Ave
- 819 E Valencia Ave
- 734 E Elmwood Ave
- 733 E Valencia Ave
- 813 E Elmwood Ave
- 826 E Elmwood Ave
- 823 E Valencia Ave
- 723 S Kenneth Rd
Your Personal Tour Guide
Ask me questions while you tour the home.