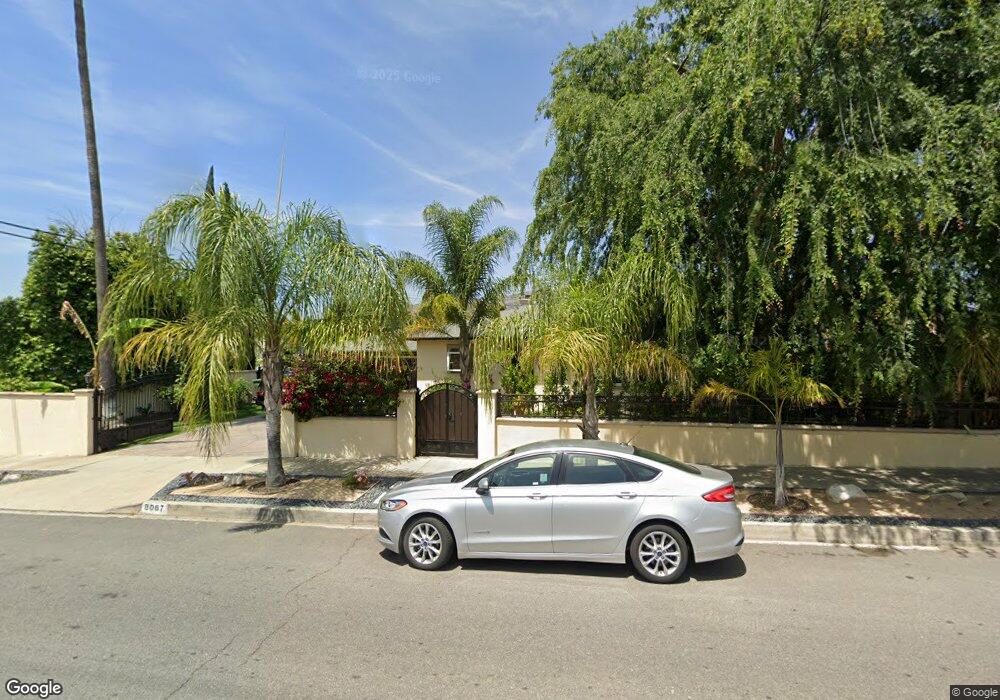
8067 Apperson St Sunland, CA 91040
Sunland NeighborhoodEstimated Value: $1,015,000 - $1,071,000
3
Beds
2
Baths
2,033
Sq Ft
$506/Sq Ft
Est. Value
About This Home
This home is located at 8067 Apperson St, Sunland, CA 91040 and is currently estimated at $1,029,548, approximately $506 per square foot. 8067 Apperson St is a home located in Los Angeles County with nearby schools including Apperson Street Elementary School, Mt. Gleason Middle School, and Verdugo Hills Senior High School.
Ownership History
Date
Name
Owned For
Owner Type
Purchase Details
Closed on
Jun 17, 2013
Sold by
Trevino Alex
Bought by
Trevino Alex and Marquez Marybel
Current Estimated Value
Purchase Details
Closed on
Jan 10, 2002
Sold by
Broquist Georgia Catherine
Bought by
Trevino Alex
Purchase Details
Closed on
Nov 22, 2000
Sold by
Broquist Georgia C
Bought by
Broquist Georgia Catherine
Home Financials for this Owner
Home Financials are based on the most recent Mortgage that was taken out on this home.
Original Mortgage
$242,250
Interest Rate
7.86%
Purchase Details
Closed on
Aug 25, 2000
Sold by
Corey Edna L
Bought by
Broquist Georgia C
Purchase Details
Closed on
Mar 18, 1999
Sold by
Corey Edna L
Bought by
Corey Edna Leona and Broquist Georgia Catherine
Home Financials for this Owner
Home Financials are based on the most recent Mortgage that was taken out on this home.
Original Mortgage
$35,800
Interest Rate
6.79%
Mortgage Type
Balloon
Purchase Details
Closed on
Jun 1, 1995
Sold by
Broquist Georgia C
Bought by
Broquist Georgia Catherine and The Georgia C Broquist Living Trust
Create a Home Valuation Report for This Property
The Home Valuation Report is an in-depth analysis detailing your home's value as well as a comparison with similar homes in the area
Home Values in the Area
Average Home Value in this Area
Purchase History
| Date | Buyer | Sale Price | Title Company |
|---|---|---|---|
| Trevino Alex | -- | None Available | |
| Trevino Alex | $80,000 | United Title Company | |
| Broquist Georgia Catherine | -- | First American Title Ins Co | |
| Broquist Georgia C | -- | -- | |
| Corey Edna Leona | -- | Chicago Title Co | |
| Broquist Georgia Catherine | -- | -- | |
| Corey Edna Leona | -- | -- |
Source: Public Records
Mortgage History
| Date | Status | Borrower | Loan Amount |
|---|---|---|---|
| Previous Owner | Broquist Georgia Catherine | $242,250 | |
| Previous Owner | Corey Edna Leona | $35,800 |
Source: Public Records
Tax History Compared to Growth
Tax History
| Year | Tax Paid | Tax Assessment Tax Assessment Total Assessment is a certain percentage of the fair market value that is determined by local assessors to be the total taxable value of land and additions on the property. | Land | Improvement |
|---|---|---|---|---|
| 2025 | $5,709 | $463,778 | $251,127 | $212,651 |
| 2024 | $5,709 | $454,685 | $246,203 | $208,482 |
| 2023 | $5,601 | $445,771 | $241,376 | $204,395 |
| 2022 | $5,344 | $437,032 | $236,644 | $200,388 |
| 2021 | $5,269 | $428,463 | $232,004 | $196,459 |
| 2019 | $5,113 | $415,757 | $225,124 | $190,633 |
| 2018 | $5,008 | $407,606 | $220,710 | $186,896 |
| 2016 | $4,768 | $391,781 | $212,141 | $179,640 |
| 2015 | $4,699 | $385,897 | $208,955 | $176,942 |
| 2014 | $4,720 | $378,338 | $204,862 | $173,476 |
Source: Public Records
Map
Nearby Homes
- 7961 Apperson St
- 7961 Day St
- 10300 Whitegate Ave
- 10430 Mcvine Ave
- 10415 Mcvine Ave Unit 2
- 10429 Mcvine Ave
- 10414 Whitegate Ave
- 10404 Jardine Ave
- 7951 Glenties Ln
- 10109 Parr Ave
- 10141 Scoville Ave
- 7755 Day St
- 8352 Wyngate St
- 10623 Woodward Ave
- 10335 Oro Vista Ave
- 10529 Mount Gleason Ave
- 10250 Quill Ave
- 7851 Fenwick St
- 10227 Quill Ave
- 7651 Valmont St
- 8105 Apperson St
- 10301 Langmuir Ave
- 10308 Mather Ave
- 10309 Langmuir Ave
- 10333 Langmuir Ave
- 10257 Langmuir Ave
- 10314 Mather Ave
- 10254 Mather Ave
- 10320 Mather Ave
- 10251 Langmuir Ave
- 10256 Langmuir Ave
- 10248 Mather Ave
- 10301 Mather Ave
- 10326 Langmuir Ave
- 10320 Langmuir Ave
- 10328 Mather Ave
- 10332 Langmuir Ave
- 10311 Mather Ave
- 10245 Langmuir Ave
- 10300 Langmuir Ave