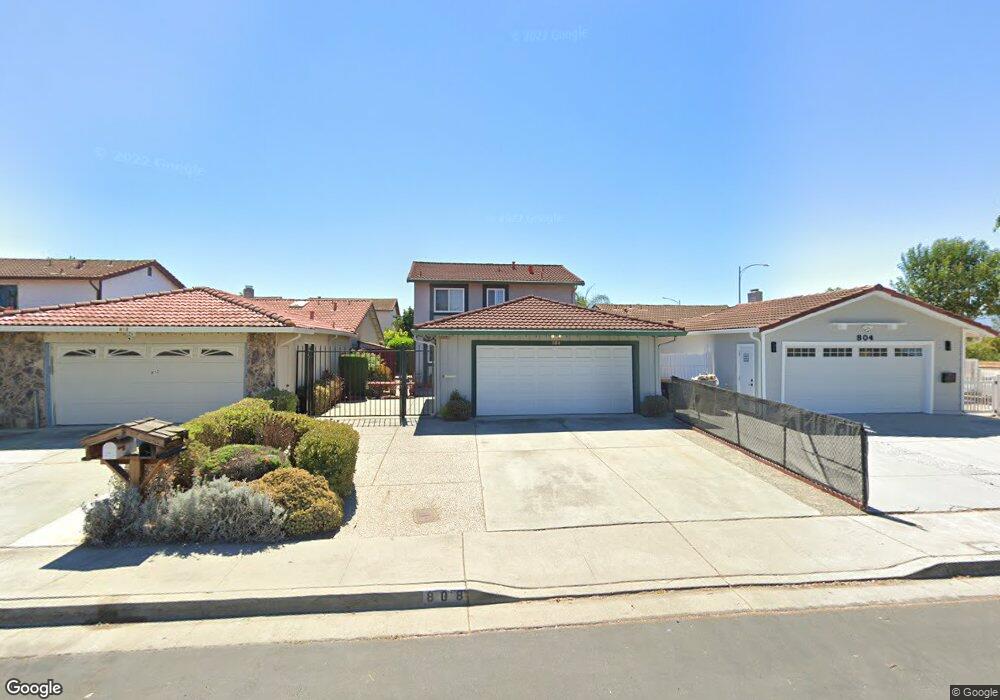
808 Saraband Way San Jose, CA 95122
Kennedy NeighborhoodEstimated Value: $896,000 - $1,168,000
4
Beds
3
Baths
1,408
Sq Ft
$711/Sq Ft
Est. Value
About This Home
This home is located at 808 Saraband Way, San Jose, CA 95122 and is currently estimated at $1,000,524, approximately $710 per square foot. 808 Saraband Way is a home located in Santa Clara County with nearby schools including Robert F. Kennedy Elementary School, Sylvandale Middle School, and Yerba Buena High School.
Ownership History
Date
Name
Owned For
Owner Type
Purchase Details
Closed on
Aug 9, 2020
Sold by
Nanquil Carmencita and Nanquil Jose G
Bought by
Jose G Nanquil Jr Family and Nanquil
Current Estimated Value
Home Financials for this Owner
Home Financials are based on the most recent Mortgage that was taken out on this home.
Original Mortgage
$460,000
Interest Rate
2.4%
Mortgage Type
New Conventional
Purchase Details
Closed on
Jul 1, 2015
Sold by
Nanquil Jose G and Nanquil Carmencita
Bought by
Jose G Nanquil Jr Family Trust and Nanquil Carmencita
Purchase Details
Closed on
Sep 19, 1997
Sold by
Nanquil Jose G
Bought by
Nanquil Jose G and Nanquil Carmencita
Home Financials for this Owner
Home Financials are based on the most recent Mortgage that was taken out on this home.
Original Mortgage
$112,000
Interest Rate
7.44%
Purchase Details
Closed on
Mar 17, 1994
Sold by
Nanquil Jose G and Nanquil Jose G
Bought by
Nanquil Jose G and Nanquil Carmencita
Create a Home Valuation Report for This Property
The Home Valuation Report is an in-depth analysis detailing your home's value as well as a comparison with similar homes in the area
Home Values in the Area
Average Home Value in this Area
Purchase History
| Date | Buyer | Sale Price | Title Company |
|---|---|---|---|
| Jose G Nanquil Jr Family | -- | None Listed On Document | |
| Nanquil Carmencita | -- | Amrock Inc | |
| Jose G Nanquil Jr Family Trust | -- | None Available | |
| Nanquil Jose G | -- | Golden California Title Co | |
| Nanquil Jose G | -- | -- |
Source: Public Records
Mortgage History
| Date | Status | Borrower | Loan Amount |
|---|---|---|---|
| Previous Owner | Nanquil Carmencita | $460,000 | |
| Previous Owner | Nanquil Jose G | $112,000 |
Source: Public Records
Tax History Compared to Growth
Tax History
| Year | Tax Paid | Tax Assessment Tax Assessment Total Assessment is a certain percentage of the fair market value that is determined by local assessors to be the total taxable value of land and additions on the property. | Land | Improvement |
|---|---|---|---|---|
| 2025 | $3,541 | $157,729 | $20,764 | $136,965 |
| 2024 | $3,541 | $154,637 | $20,357 | $134,280 |
| 2023 | $3,452 | $151,606 | $19,958 | $131,648 |
| 2022 | $3,385 | $148,634 | $19,567 | $129,067 |
| 2021 | $3,302 | $145,721 | $19,184 | $126,537 |
| 2020 | $3,112 | $144,228 | $18,988 | $125,240 |
| 2019 | $2,981 | $141,401 | $18,616 | $122,785 |
| 2018 | $2,949 | $138,629 | $18,251 | $120,378 |
| 2017 | $2,901 | $135,912 | $17,894 | $118,018 |
| 2016 | $2,759 | $133,248 | $17,544 | $115,704 |
| 2015 | $2,700 | $131,248 | $17,281 | $113,967 |
| 2014 | $2,271 | $128,678 | $16,943 | $111,735 |
Source: Public Records
Map
Nearby Homes
- 835 Saraband Way
- 810 Vintage Way
- 963 Mills Corner Ln
- 1714 Bevin Brook Dr
- 1704 Bevin Brook Dr
- 1362 Mcquesten Dr Unit A
- 1887 Aberdeen Ct
- 988 Summerplace Dr
- 1231 Turtlerock Dr
- 1550 Crucero Dr
- 1077 Summerain Ct
- 2015 Tahiti Ct
- 1068 Summershore Ct
- 1087 Summerain Ct
- 1050 Summermist Ct
- 1042 Summermist Ct Unit 107
- 1117 Indian Summer Ct
- 1386 Sunbeam Cir
- 2175 Summerton Dr
- 2102 Galveston Ave Unit A
- 812 Saraband Way
- 804 Saraband Way
- 816 Saraband Way
- 817 Derbe Dr
- 820 Saraband Way
- 821 Derbe Dr
- 807 Derbe Dr
- 825 Derbe Dr
- 1490 Roberts Ave
- 824 Saraband Way
- 829 Derbe Dr
- 811 Saraband Way
- 815 Saraband Way
- 1480 Roberts Ave
- 828 Saraband Way
- 833 Derbe Dr
- 819 Saraband Way
- 1554 Trieste Way
- 1470 Roberts Ave
- 832 Saraband Way