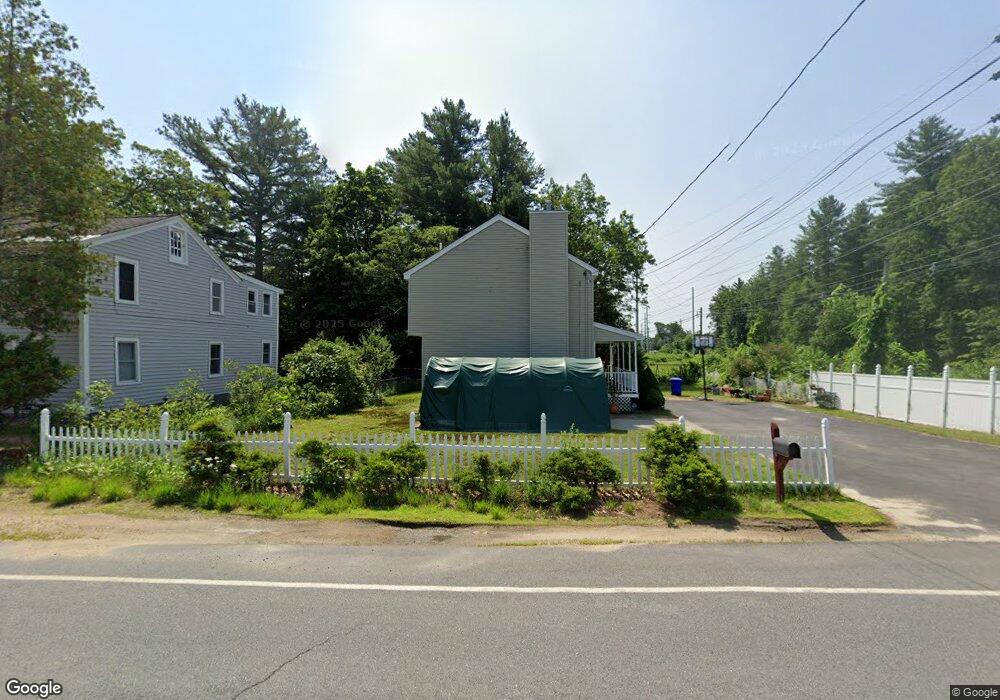
81 Highland St Hudson, NH 03051
Estimated Value: $502,000 - $535,000
3
Beds
2
Baths
1,600
Sq Ft
$320/Sq Ft
Est. Value
About This Home
This home is located at 81 Highland St, Hudson, NH 03051 and is currently estimated at $512,501, approximately $320 per square foot. 81 Highland St is a home located in Hillsborough County with nearby schools including White Wing School and Clearway High School.
Ownership History
Date
Name
Owned For
Owner Type
Purchase Details
Closed on
Dec 1, 2004
Sold by
Higgins 2Nd Phillip B and Higgins Dolores Mae
Bought by
Tran David Dung
Current Estimated Value
Home Financials for this Owner
Home Financials are based on the most recent Mortgage that was taken out on this home.
Original Mortgage
$100,000
Outstanding Balance
$49,947
Interest Rate
5.69%
Mortgage Type
Purchase Money Mortgage
Estimated Equity
$462,554
Purchase Details
Closed on
Jul 3, 2001
Sold by
Empire Homes Inc
Bought by
Higgins Phillip B
Home Financials for this Owner
Home Financials are based on the most recent Mortgage that was taken out on this home.
Original Mortgage
$188,993
Interest Rate
7.14%
Purchase Details
Closed on
Mar 8, 2001
Sold by
Harnum Judith
Bought by
Empire Homes Inc
Create a Home Valuation Report for This Property
The Home Valuation Report is an in-depth analysis detailing your home's value as well as a comparison with similar homes in the area
Home Values in the Area
Average Home Value in this Area
Purchase History
| Date | Buyer | Sale Price | Title Company |
|---|---|---|---|
| Tran David Dung | $272,500 | -- | |
| Higgins Phillip B | $196,000 | -- | |
| Empire Homes Inc | $37,000 | -- |
Source: Public Records
Mortgage History
| Date | Status | Borrower | Loan Amount |
|---|---|---|---|
| Open | Empire Homes Inc | $100,000 | |
| Previous Owner | Empire Homes Inc | $188,993 |
Source: Public Records
Tax History Compared to Growth
Tax History
| Year | Tax Paid | Tax Assessment Tax Assessment Total Assessment is a certain percentage of the fair market value that is determined by local assessors to be the total taxable value of land and additions on the property. | Land | Improvement |
|---|---|---|---|---|
| 2024 | $6,374 | $387,500 | $102,600 | $284,900 |
| 2023 | $6,076 | $387,500 | $102,600 | $284,900 |
| 2022 | $5,692 | $387,500 | $102,600 | $284,900 |
| 2021 | $5,114 | $236,000 | $73,600 | $162,400 |
| 2020 | $5,043 | $236,000 | $73,600 | $162,400 |
| 2019 | $4,802 | $236,800 | $73,600 | $163,200 |
| 2018 | $4,760 | $236,800 | $73,600 | $163,200 |
| 2017 | $4,670 | $236,800 | $73,600 | $163,200 |
| 2016 | $4,664 | $212,300 | $70,200 | $142,100 |
| 2015 | $4,511 | $212,300 | $70,200 | $142,100 |
| 2014 | $4,422 | $212,300 | $70,200 | $142,100 |
| 2013 | $4,365 | $212,300 | $70,200 | $142,100 |
Source: Public Records
Map
Nearby Homes
- 73 Ferry St
- 152 Ferry St
- 98 Barbara Ln
- 4 Washington St
- 38 Robin Dr
- 21 Library St
- 39 Library St
- 37 Library St
- 10 Wagner Way
- 13 Riverside Dr
- 1 Sheraton Dr Unit B
- 1 Sheraton Dr
- 434 Abbott Farm Ln
- 213 Abbott Farm Ln
- 312 Abbott Farm Ln
- 49 Cobblestone Dr
- 35 B St Unit 5
- 40B Brackett Ln
- 36 Sutherland Dr
- 319 Fox Run Rd