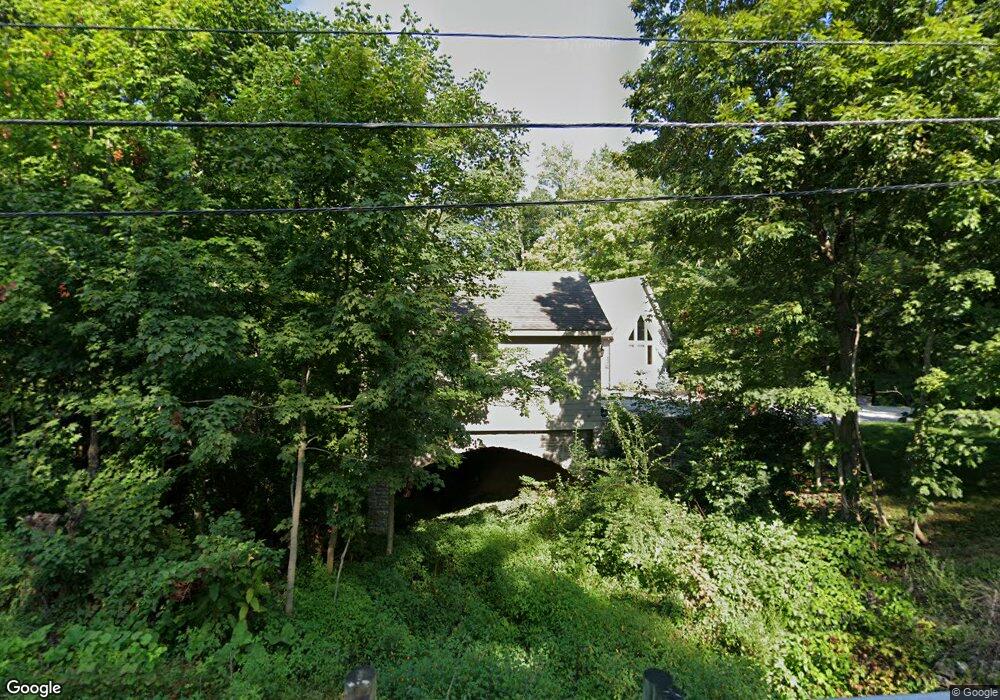
8101 Flint Rd Columbus, OH 43235
Village at Worthington NeighborhoodEstimated Value: $669,000 - $960,000
5
Beds
5
Baths
4,305
Sq Ft
$177/Sq Ft
Est. Value
About This Home
This home is located at 8101 Flint Rd, Columbus, OH 43235 and is currently estimated at $763,489, approximately $177 per square foot. 8101 Flint Rd is a home located in Franklin County with nearby schools including Worthington Estates Elementary School, Worthingway Middle School, and Thomas Worthington High School.
Ownership History
Date
Name
Owned For
Owner Type
Purchase Details
Closed on
May 13, 2019
Sold by
Battisti Jeff B and Battisti Morgan K
Bought by
Hicks Brady C and Taylor Deborah O
Current Estimated Value
Home Financials for this Owner
Home Financials are based on the most recent Mortgage that was taken out on this home.
Original Mortgage
$481,644
Interest Rate
4.1%
Mortgage Type
New Conventional
Purchase Details
Closed on
Apr 24, 2006
Sold by
Beshara Karen
Bought by
Battisti Jeff B and Battisti Morgan K
Home Financials for this Owner
Home Financials are based on the most recent Mortgage that was taken out on this home.
Original Mortgage
$375,920
Interest Rate
6.48%
Mortgage Type
Fannie Mae Freddie Mac
Purchase Details
Closed on
Dec 11, 1996
Sold by
O'Neill Edward T
Bought by
Karen Beshara
Purchase Details
Closed on
Jul 23, 1991
Purchase Details
Closed on
Apr 17, 1991
Create a Home Valuation Report for This Property
The Home Valuation Report is an in-depth analysis detailing your home's value as well as a comparison with similar homes in the area
Home Values in the Area
Average Home Value in this Area
Purchase History
| Date | Buyer | Sale Price | Title Company |
|---|---|---|---|
| Hicks Brady C | $535,200 | Northwest Select Ttl Agcy Ll | |
| Battisti Jeff B | $469,000 | Focus Title | |
| Karen Beshara | $45,000 | -- | |
| -- | $40,500 | -- | |
| -- | $25,000 | -- |
Source: Public Records
Mortgage History
| Date | Status | Borrower | Loan Amount |
|---|---|---|---|
| Previous Owner | Hicks Brady C | $481,644 | |
| Previous Owner | Battisti Jeff B | $375,920 |
Source: Public Records
Tax History
| Year | Tax Paid | Tax Assessment Tax Assessment Total Assessment is a certain percentage of the fair market value that is determined by local assessors to be the total taxable value of land and additions on the property. | Land | Improvement |
|---|---|---|---|---|
| 2025 | $11,834 | $192,750 | $47,600 | $145,150 |
| 2024 | $11,834 | $192,750 | $47,600 | $145,150 |
| 2023 | $11,316 | $192,745 | $47,600 | $145,145 |
| 2022 | $12,627 | $170,660 | $27,370 | $143,290 |
| 2021 | $11,649 | $170,660 | $27,370 | $143,290 |
| 2020 | $11,221 | $170,660 | $27,370 | $143,290 |
| 2019 | $13,837 | $189,910 | $23,800 | $166,110 |
| 2018 | $11,720 | $189,910 | $23,800 | $166,110 |
| 2017 | $12,400 | $189,910 | $23,800 | $166,110 |
| 2016 | $10,034 | $141,330 | $27,230 | $114,100 |
| 2015 | $10,036 | $141,330 | $27,230 | $114,100 |
| 2014 | $10,032 | $141,330 | $27,230 | $114,100 |
| 2013 | $4,991 | $141,330 | $27,230 | $114,100 |
Source: Public Records
Map
Nearby Homes
- 365 Cover Place
- 70 Highbluffs Blvd Unit 70
- 8483 Olenbrook Dr
- 627 Ozem Gardner Way
- 93 Forest Ridge Ct
- 8322 Bruntsfield Rd Unit 8322
- 8326 Bruntsfield Rd
- 703 Suntree Dr
- 8100 Treebrook Ln
- 8380 Orchard Knoll Ln Unit 8380
- 8422 Nuthatch Way
- 579 Mawyer Dr Unit 168
- 7853 Barkwood Dr Unit 18C
- 112 Purple Leaf Ln
- 8726 Woodwind Dr
- 145 Feathertip Ln
- 7835 Barkwood Dr
- 860 Philadelphia Dr Unit 23A
- 348 Holly Grove Rd
- 8747 Olenbrook Dr
- 8119 Flint Rd
- 201 Lake Bluff Dr
- 8096 Flint Rd
- 8080 Flint Rd
- 217 Lake Bluff Dr
- 8133 Flint Rd
- 8069 Flint Rd
- 209 Lake Bluff Dr
- 193 Lake Bluff Dr
- 185 Lake Bluff Dr
- 225 Lake Bluff Dr
- 0 Flint Rd
- 8147 Flint Rd
- 8154 Flint Rd
- 249 Shale Ridge Ct
- 300 Cover Place
- 302 Cover Place
- 8045 Flint Rd
- 8058 Flint Rd
- 171 Melyers Ct
Your Personal Tour Guide
Ask me questions while you tour the home.