NOT LISTED FOR SALE

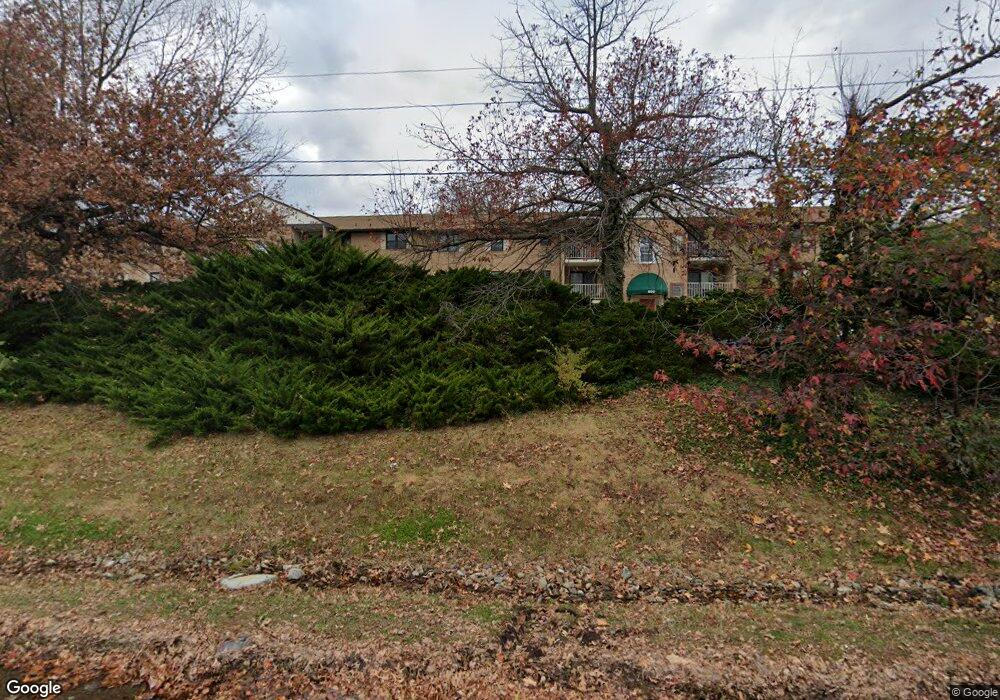
811 Governor House Cir Unit 811 Wilmington, DE 19809

Estimated Value: $155,000 - $158,395

2 Beds
2 Baths
825 Sq Ft
$190/Sq Ft Est. Value

About This Home

This home is located at 811 Governor House Cir Unit 811, Wilmington, DE 19809 and is currently estimated at $156,465, approximately $189 per square foot. 811 Governor House Cir Unit 811 is a home located in New Castle County with nearby schools including Mount Pleasant Elementary School, Pierre S. Dupont Middle School, and Mount Pleasant High School.

Ownership History

Date Name Owned For Owner Type

Purchase Details

Closed on
Oct 9, 2020
Sold by
Mancuso Danielle L
Bought by
Mancuso Danielle L and Mancuso Anthony
Current Estimated Value
$156,465

Purchase Details

Closed on
Dec 15, 2016
Sold by
Bayview Loan Servicing Llc
Bought by
Mancuso Danielle L

Purchase Details

Closed on
Sep 14, 2016
Sold by
Bank Of America Na
Bought by
Bayview Loan Servicing Llc

Purchase Details

Closed on
Feb 24, 2010
Sold by
Ross Karen L
Bought by
Gudzune Jeffrey R

Home Financials for this Owner

Home Financials are based on the most recent Mortgage that was taken out on this home.
Original Mortgage
$85,063
Interest Rate
4.99%
Mortgage Type
FHA

Purchase Details

Closed on
Apr 12, 2004
Sold by
Graham Albert J
Bought by
Rose Karen L

Home Financials for this Owner

Home Financials are based on the most recent Mortgage that was taken out on this home.
Original Mortgage
$54,800
Interest Rate
5.39%
Mortgage Type
Purchase Money Mortgage

Range of Values:

Collateral Analytics

Collateral Analytics Collateral Analytics AVMs (Automated Valuation Model) employ a number of statistical approaches combined with neighborhood-specific comparable selection guarantees the most up-to-date and precise valuations.

Not Available

Collateral Analytics does not have data for the current month. Please view the chart for historical values.

ICE

ICE Mortgage Technology ICE Mortgage Technology’s AVM (Automated Valuation Model) is a state-of-the-art online residential property valuation tool that provides a quick and accurate estimate of the value of almost any home in the U.S.

Not Available

ICE Mortgage Technology does not have data for the current month. Please view the chart for historical values.

First American

First American First American Data & Analytics’ next-generation AVM combines unrivaled data assets with a blended ensemble of valuation models to produce highly accurate, reliable valuations you can trust.

Not Available

First American does not have data for the current month. Please view the chart for historical values.

Quantarium

Quantarium Quantarium’s valuation service, repeatedly proven the industry’s most accurate and comprehensive, is supercharged with a self-learning and auto-tuning AI engine that continually becomes smarter and more accurate as it processes daily inputs from the industry’s leading RE data lake.

Not Available

Quantarium does not have data for the current month. Please view the chart for historical values.

Average Value
Not Available
List Price
Sold Price
Create a Home Valuation Report for This Property
The Home Valuation Report is an in-depth analysis detailing your home's value as well as a comparison with similar homes in the area

Home Values in the Area

Source: Public Records

Average Home Value in this Area


Source: Public Records

Purchase History

Date Buyer Sale Price Title Company
Mancuso Danielle L -- Brady William P
Mancuso Danielle L $50,500 None Available
Bayview Loan Servicing Llc $91,890 None Available
Gudzune Jeffrey R $88,000 None Available
Rose Karen L $68,500 Resource Title Llc
Source: Public Records

Mortgage History

Date Status Borrower Loan Amount
Previous Owner Gudzune Jeffrey R $85,063
Previous Owner Gudzune Jeffrey R $6,665
Previous Owner Rose Karen L $54,800
Source: Public Records

Tax History Compared to Growth

Source: Public Records

Tax History

Year Tax Paid Tax Assessment Tax Assessment Total Assessment is a certain percentage of the fair market value that is determined by local assessors to be the total taxable value of land and additions on the property. Land Improvement
2023 $1,186 $34,100 $7,000 $27,100
2022 $1,206 $34,100 $7,000 $27,100
2021 $1,206 $34,100 $7,000 $27,100
2020 $1,206 $34,100 $7,000 $27,100
2019 $1,205 $34,100 $7,000 $27,100
2018 $1,153 $34,100 $7,000 $27,100
2017 $1,135 $34,100 $7,000 $27,100
2016 $1,134 $34,100 $7,000 $27,100
2015 $1,044 $34,100 $7,000 $27,100
2014 $1,043 $34,100 $7,000 $27,100
Source: Public Records

Map