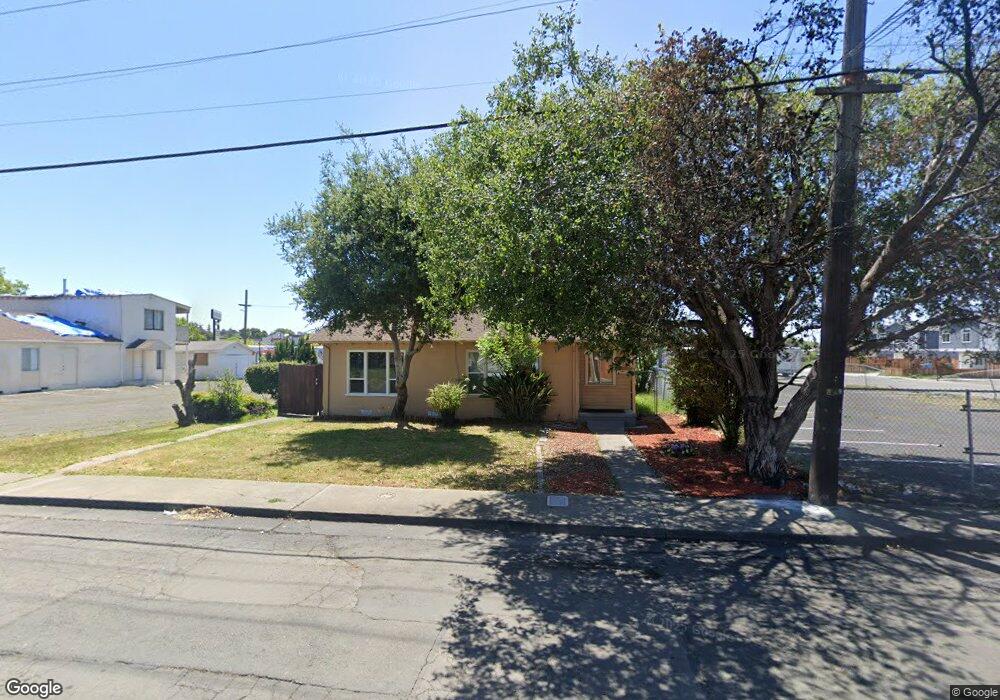
811 Springs Rd Vallejo, CA 94590
West Vallejo NeighborhoodEstimated Value: $405,996 - $439,000
3
Beds
1
Bath
948
Sq Ft
$447/Sq Ft
Est. Value
About This Home
This home is located at 811 Springs Rd, Vallejo, CA 94590 and is currently estimated at $423,499, approximately $446 per square foot. 811 Springs Rd is a home located in Solano County with nearby schools including Highland Elementary, Vallejo High School, and North Hills Christian School.
Ownership History
Date
Name
Owned For
Owner Type
Purchase Details
Closed on
Oct 25, 2015
Sold by
Terry Wert and Terry Audrey M
Bought by
The Wert Terry & Audrey M Terry Revocabl and Terry Audrey M
Current Estimated Value
Purchase Details
Closed on
Aug 13, 2003
Sold by
Terry Wert and Terry Audrey M
Bought by
Terry Wert and Terry Audrey M
Purchase Details
Closed on
Nov 10, 2000
Sold by
Carol Woodall and Carol James E
Bought by
Terry Wert and Terry Audrey H
Create a Home Valuation Report for This Property
The Home Valuation Report is an in-depth analysis detailing your home's value as well as a comparison with similar homes in the area
Home Values in the Area
Average Home Value in this Area
Purchase History
| Date | Buyer | Sale Price | Title Company |
|---|---|---|---|
| The Wert Terry & Audrey M Terry Revocabl | -- | None Available | |
| Terry Wert | -- | None Available | |
| Terry Wert | -- | -- | |
| Terry Wert | -- | -- | |
| Terry Wert | $65,000 | Frontier Title Company |
Source: Public Records
Tax History Compared to Growth
Tax History
| Year | Tax Paid | Tax Assessment Tax Assessment Total Assessment is a certain percentage of the fair market value that is determined by local assessors to be the total taxable value of land and additions on the property. | Land | Improvement |
|---|---|---|---|---|
| 2025 | $3,281 | $193,961 | $45,202 | $148,759 |
| 2024 | $3,281 | $190,159 | $44,316 | $145,843 |
| 2023 | $3,065 | $186,432 | $43,448 | $142,984 |
| 2022 | $2,963 | $182,778 | $42,597 | $140,181 |
| 2021 | $2,896 | $179,195 | $41,762 | $137,433 |
| 2020 | $2,896 | $177,358 | $41,334 | $136,024 |
| 2019 | $2,796 | $173,881 | $40,524 | $133,357 |
| 2018 | $2,609 | $170,473 | $39,730 | $130,743 |
| 2017 | $2,481 | $167,131 | $38,951 | $128,180 |
| 2016 | $1,911 | $163,855 | $38,188 | $125,667 |
| 2015 | $1,886 | $161,395 | $37,615 | $123,780 |
| 2014 | $1,858 | $158,000 | $28,000 | $130,000 |
Source: Public Records
Map
Nearby Homes