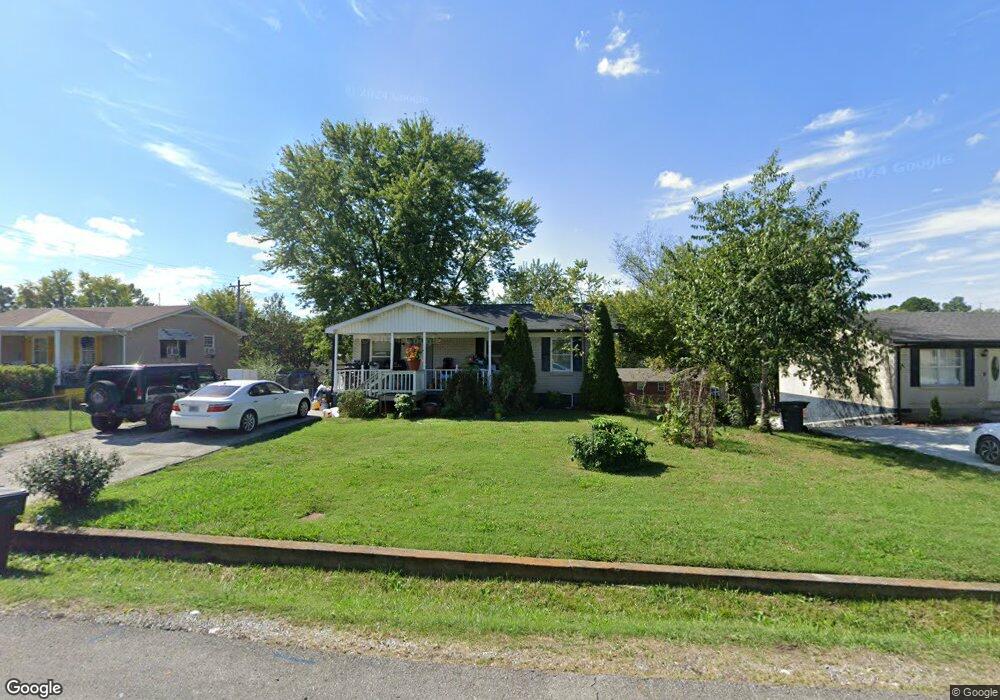
813 Goldcrest Dr Springfield, TN 37172
Estimated Value: $188,000 - $276,000
--
Bed
2
Baths
900
Sq Ft
$238/Sq Ft
Est. Value
About This Home
This home is located at 813 Goldcrest Dr, Springfield, TN 37172 and is currently estimated at $214,599, approximately $238 per square foot. 813 Goldcrest Dr is a home located in Robertson County with nearby schools including Krisle Elementary School, Innovation Academy, and Springfield High School.
Ownership History
Date
Name
Owned For
Owner Type
Purchase Details
Closed on
Jun 20, 2024
Sold by
Goldcrest Property
Bought by
Rush Donald and Rush Judith
Current Estimated Value
Home Financials for this Owner
Home Financials are based on the most recent Mortgage that was taken out on this home.
Original Mortgage
$692,750
Outstanding Balance
$271,322
Interest Rate
7.09%
Mortgage Type
New Conventional
Estimated Equity
-$56,723
Purchase Details
Closed on
Jan 30, 2013
Sold by
Vander Hengst Willem
Bought by
Rush Donald and Rush Judith
Purchase Details
Closed on
Oct 1, 2012
Sold by
First State Bank
Bought by
Goldcrest Property
Purchase Details
Closed on
Mar 1, 2012
Sold by
Oakwood Property
Bought by
First State Bank
Purchase Details
Closed on
Feb 28, 2008
Sold by
Tcif Reo Gcm Llc
Bought by
Oakwood Property Management Ll
Purchase Details
Closed on
Feb 21, 2007
Sold by
Utley Virgil L
Bought by
Tcif Reo Gcm Llc
Purchase Details
Closed on
Jul 10, 1971
Bought by
Utley Virgil L
Create a Home Valuation Report for This Property
The Home Valuation Report is an in-depth analysis detailing your home's value as well as a comparison with similar homes in the area
Home Values in the Area
Average Home Value in this Area
Purchase History
| Date | Buyer | Sale Price | Title Company |
|---|---|---|---|
| Rush Donald | -- | Warranty Title | |
| Rush Donald | -- | -- | |
| Goldcrest Property | $35,000 | -- | |
| First State Bank | -- | -- | |
| Oakwood Property Management Ll | $48,000 | -- | |
| Tcif Reo Gcm Llc | $60,000 | -- | |
| Utley Virgil L | -- | -- |
Source: Public Records
Mortgage History
| Date | Status | Borrower | Loan Amount |
|---|---|---|---|
| Open | Rush Donald | $692,750 |
Source: Public Records
Tax History Compared to Growth
Tax History
| Year | Tax Paid | Tax Assessment Tax Assessment Total Assessment is a certain percentage of the fair market value that is determined by local assessors to be the total taxable value of land and additions on the property. | Land | Improvement |
|---|---|---|---|---|
| 2024 | -- | $47,025 | $15,000 | $32,025 |
| 2023 | $1,178 | $47,025 | $15,000 | $32,025 |
| 2022 | $755 | $20,675 | $3,450 | $17,225 |
| 2021 | $755 | $20,675 | $3,450 | $17,225 |
| 2020 | $755 | $20,675 | $3,450 | $17,225 |
| 2019 | $22,733 | $20,675 | $3,450 | $17,225 |
| 2018 | $755 | $20,675 | $3,450 | $17,225 |
| 2017 | $721 | $16,825 | $2,550 | $14,275 |
| 2016 | $721 | $16,825 | $2,550 | $14,275 |
| 2015 | $700 | $16,825 | $2,550 | $14,275 |
| 2014 | $700 | $16,825 | $2,550 | $14,275 |
Source: Public Records
Map
Nearby Homes
- 811 Perry Dr
- 54 Hunters Ln
- 1183 Hangar Rd
- 822 Pitt Ave
- 514 8th Ave E
- 17&18 Wartrace Rd
- 1603 Mantlo St
- 17 Spring Creek Hills
- 519 S Pawnee Dr
- 401 S Pawnee Dr
- 109 E 7th Ave
- 633 E 17th Ave
- 629 E 17th Ave
- 1711 Woodside Dr
- 203 15th Ave E
- 1105 Shaylee Dr
- 3092 Sofia Ln
- 409 N Oak St
- 1 Tom Austin Hwy
- 342 Crescent Dr
- 815 Goldcrest Dr
- 811 Goldcrest Dr
- 808 8th Ave E
- 806 8th Ave E
- 817 Goldcrest Dr
- 809 Goldcrest Dr
- 810 8th Ave E
- 814 Goldcrest Dr
- 804 8th Ave E
- 812 Goldcrest Dr
- 819 Goldcrest Dr
- 807 Goldcrest Dr
- 810 Goldcrest Dr
- 818 Goldcrest Dr
- 808 Goldcrest Dr
- 802 8th Ave E
- 821 Goldcrest Dr
- 820 Goldcrest Dr
- 803 8th Ave E
- 805 Goldcrest Dr