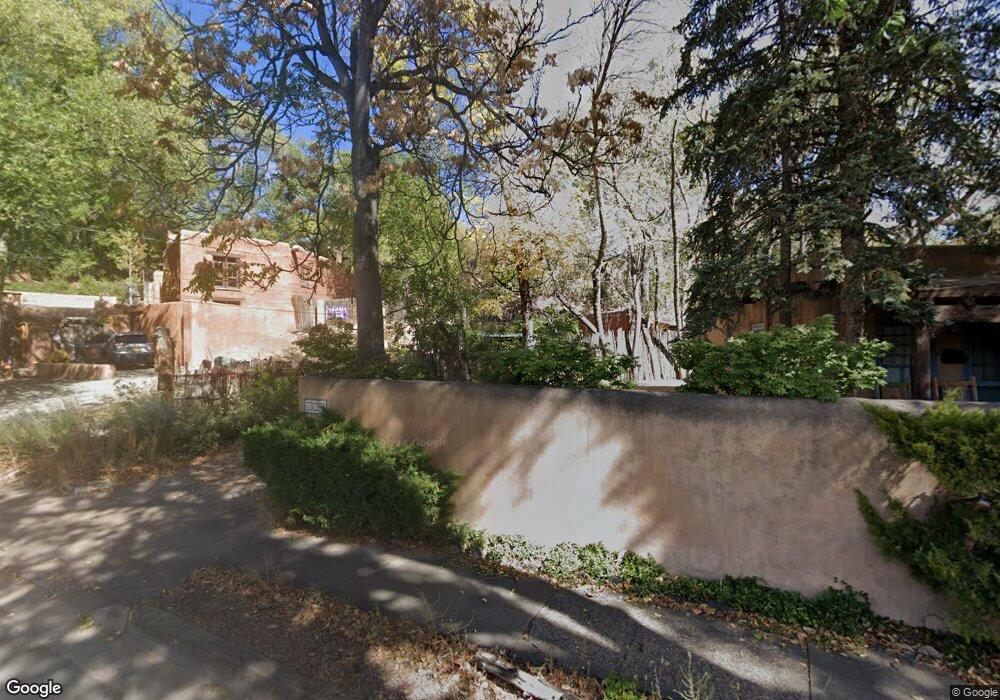
815 E Palace Ave Santa Fe, NM 87501
North Hills NeighborhoodEstimated Value: $1,203,000 - $1,530,240
4
Beds
--
Bath
2,524
Sq Ft
$535/Sq Ft
Est. Value
About This Home
This home is located at 815 E Palace Ave, Santa Fe, NM 87501 and is currently estimated at $1,350,810, approximately $535 per square foot. 815 E Palace Ave is a home located in Santa Fe County with nearby schools including Acequia Madre Elementary School, Santa Fe High School, and New Mexico School for the Arts.
Ownership History
Date
Name
Owned For
Owner Type
Purchase Details
Closed on
Oct 8, 2019
Sold by
Resnick Barnet
Bought by
Lano Palace Llc
Current Estimated Value
Purchase Details
Closed on
Apr 25, 2019
Sold by
Resnick Barnet and Resnick Merle
Bought by
Resnick Barnet and Barnet Resnick
Purchase Details
Closed on
Sep 25, 2009
Sold by
Jacobs Donald and Brinkerhoff Jacobs Julie
Bought by
Resnick Barnet and Resnick Merle
Purchase Details
Closed on
Jun 16, 2008
Sold by
Resnick Barnet and Resnick Merle
Bought by
Resnick Barnet and Resnick Merle
Home Financials for this Owner
Home Financials are based on the most recent Mortgage that was taken out on this home.
Original Mortgage
$441,500
Interest Rate
5%
Mortgage Type
New Conventional
Purchase Details
Closed on
Jun 25, 1999
Sold by
Stein Joel B and Stein Mary
Bought by
Vinci Susan E
Home Financials for this Owner
Home Financials are based on the most recent Mortgage that was taken out on this home.
Original Mortgage
$280,000
Interest Rate
7.11%
Create a Home Valuation Report for This Property
The Home Valuation Report is an in-depth analysis detailing your home's value as well as a comparison with similar homes in the area
Home Values in the Area
Average Home Value in this Area
Purchase History
| Date | Buyer | Sale Price | Title Company |
|---|---|---|---|
| Lano Palace Llc | -- | Prima Title Llc | |
| Resnick Barnet | -- | None Available | |
| Resnick Barnet | -- | Accommodation | |
| Resnick Barnet | -- | Service Link | |
| Vinci Susan E | -- | -- |
Source: Public Records
Mortgage History
| Date | Status | Borrower | Loan Amount |
|---|---|---|---|
| Previous Owner | Resnick Barnet | $441,500 | |
| Previous Owner | Vinci Susan E | $280,000 |
Source: Public Records
Tax History
| Year | Tax Paid | Tax Assessment Tax Assessment Total Assessment is a certain percentage of the fair market value that is determined by local assessors to be the total taxable value of land and additions on the property. | Land | Improvement |
|---|---|---|---|---|
| 2025 | $5,507 | $725,448 | -- | $725,448 |
| 2024 | $5,367 | $704,319 | -- | $704,319 |
| 2023 | $5,367 | $683,805 | $0 | $683,805 |
| 2022 | $5,248 | $663,889 | $0 | $663,889 |
| 2021 | $5,167 | $214,851 | $0 | $214,851 |
| 2020 | $5,226 | $217,485 | $0 | $217,485 |
| 2019 | $2,711 | $111,065 | $0 | $111,065 |
| 2018 | $2,651 | $107,830 | $0 | $107,830 |
| 2017 | $2,584 | $104,690 | $0 | $104,690 |
| 2016 | $2,437 | $101,641 | $0 | $101,641 |
| 2015 | $2,380 | $98,680 | $0 | $98,680 |
| 2014 | $2,238 | $95,711 | $0 | $95,711 |
Source: Public Records
Map
Nearby Homes
- 815 E Palace Ave Unit 22
- 707 E Palace Ave Unit 8
- 707 E Palace Ave Unit 11
- 5 Cerro Gordo Rd Unit 1
- 840 E Palace Ave Unit 6
- 1 Cerro Gordo Rd Unit B
- 841 E Alameda St Unit C
- 868 E Alameda St
- 637 E Alameda St
- 220 Rodriguez St
- 630 E Alameda St Unit A, B, C, E, F, G & I
- 227 Rodriguez St
- 516 Hillside Ave
- 634 Canyon Rd
- 535 Hillside Ave
- 531 Hillside Ave
- 608 Canyon Rd Unit A & B
- 420 Camino Don Miguel
- 609 Vista de La Ciudad
- 761 Aspen Compound
- 815 E Palace Ave
- 815 E Palace Ave
- 815 E Palace Ave Unit 18
- 815 E Palace Ave Unit 19
- 815 E Palace Ave
- 815 E Palace Ave
- 815 E Palace Ave
- 815 E Palace Ave
- 815 E Palace Ave
- 815 E Palace Ave
- 815 E Palace Ave
- 815 E Palace Ave Unit 27
- 815 E Palace Ave
- 815 E Palace Ave
- 815 E Palace Ave Unit 7
- 815 E Palace Ave
- 815 E Palace Ave
- 815 E Palace Ave
- 815 E Palace Ave Unit 15
- 815 E Palace Ave
Your Personal Tour Guide
Ask me questions while you tour the home.