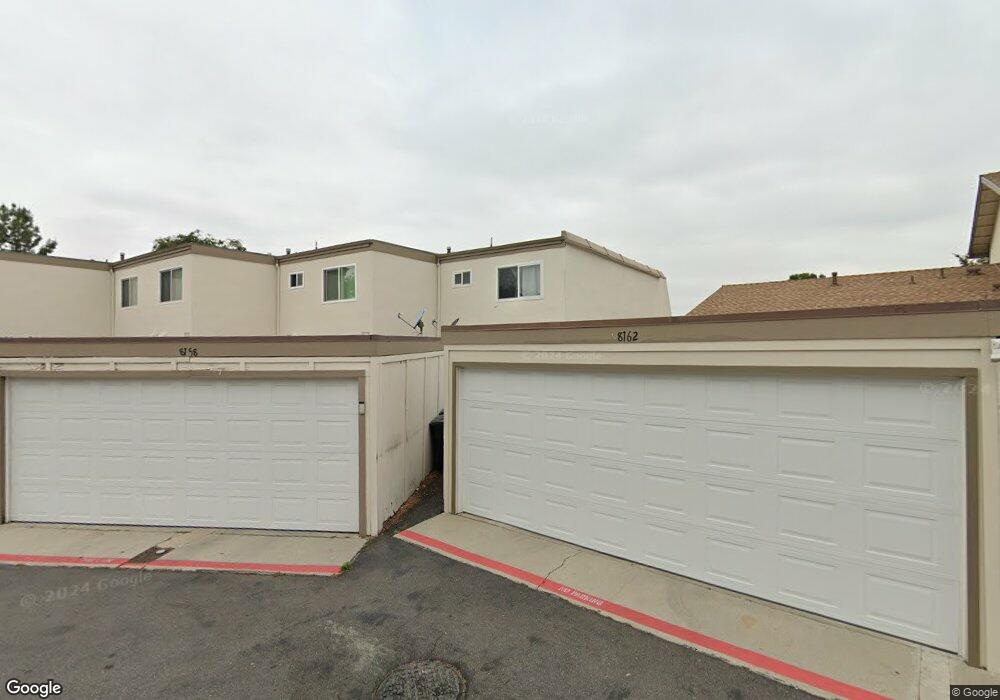
8158 Hunter Green Buena Park, CA 90621
Estimated Value: $637,530 - $678,000
2
Beds
2
Baths
1,088
Sq Ft
$596/Sq Ft
Est. Value
About This Home
This home is located at 8158 Hunter Green, Buena Park, CA 90621 and is currently estimated at $648,133, approximately $595 per square foot. 8158 Hunter Green is a home located in Orange County with nearby schools including Gordon H. Beatty Elementary School, Buena Park Junior High School, and Sunny Hills High School.
Ownership History
Date
Name
Owned For
Owner Type
Purchase Details
Closed on
Feb 11, 2003
Sold by
Gallagher Eileen M
Bought by
Chiles Stephen R and Chiles Balinda S
Current Estimated Value
Home Financials for this Owner
Home Financials are based on the most recent Mortgage that was taken out on this home.
Original Mortgage
$161,600
Outstanding Balance
$68,603
Interest Rate
5.83%
Estimated Equity
$579,530
Purchase Details
Closed on
Nov 19, 2001
Sold by
Egert Steven D and Egert Megan
Bought by
Gallagher Eileen M
Home Financials for this Owner
Home Financials are based on the most recent Mortgage that was taken out on this home.
Original Mortgage
$164,900
Interest Rate
6.39%
Create a Home Valuation Report for This Property
The Home Valuation Report is an in-depth analysis detailing your home's value as well as a comparison with similar homes in the area
Home Values in the Area
Average Home Value in this Area
Purchase History
| Date | Buyer | Sale Price | Title Company |
|---|---|---|---|
| Chiles Stephen R | $202,000 | Fidelity National Title Ins | |
| Gallagher Eileen M | $170,000 | North American Title Co |
Source: Public Records
Mortgage History
| Date | Status | Borrower | Loan Amount |
|---|---|---|---|
| Open | Chiles Stephen R | $161,600 | |
| Previous Owner | Gallagher Eileen M | $164,900 | |
| Closed | Chiles Stephen R | $30,300 |
Source: Public Records
Tax History Compared to Growth
Tax History
| Year | Tax Paid | Tax Assessment Tax Assessment Total Assessment is a certain percentage of the fair market value that is determined by local assessors to be the total taxable value of land and additions on the property. | Land | Improvement |
|---|---|---|---|---|
| 2025 | $3,416 | $292,552 | $221,339 | $71,213 |
| 2024 | $3,416 | $286,816 | $216,999 | $69,817 |
| 2023 | $3,343 | $281,193 | $212,744 | $68,449 |
| 2022 | $3,286 | $275,680 | $208,573 | $67,107 |
| 2021 | $3,260 | $270,275 | $204,483 | $65,792 |
| 2020 | $3,219 | $267,504 | $202,386 | $65,118 |
| 2019 | $3,144 | $262,259 | $198,417 | $63,842 |
| 2018 | $3,084 | $257,117 | $194,526 | $62,591 |
| 2017 | $3,039 | $252,076 | $190,712 | $61,364 |
| 2016 | $2,978 | $247,134 | $186,973 | $60,161 |
| 2015 | $2,852 | $243,422 | $184,164 | $59,258 |
| 2014 | $2,839 | $238,654 | $180,556 | $58,098 |
Source: Public Records
Map
Nearby Homes
- 8244 Henderson Green
- 4738 Durango Dr
- 4900 Lincolnshire Ave
- 5412 Arrowhead Ave
- 14806 Faceta Dr
- 14828 Rayfield Dr
- 14724 Mercado Ave
- 15213 Santa Gertrudes Ave Unit W106
- 2150 Cheyenne Way Unit 169
- 15233 Santa Gertrudes Ave
- 15032 Ocaso Ave
- 5588 Cajon Ave
- 15220 Ocaso Ave Unit H103
- 15224 Ocaso Ave Unit H212
- 8542 Emerywood Dr
- 2200 Cheyenne Way Unit 117
- 9 Coveside Ct
- 14727 La Mesa Dr
- 5471 Jonesboro Way
- 15440 Illora Dr
- 8154 Hunter Green
- 8162 Gordon Green
- 8150 Hunter Green
- 8168 Gordon Green
- 8146 Hunter Green
- 8172 Gordon Green
- 8142 Hunter Green
- 8176 Gordon Green
- 8155 Hunter Green
- 8138 Hunter Green
- 8151 Hunter Green
- 5071 Argyle Dr
- 8180 Gordon Green
- 5075 Argyle Dr
- 8147 Hunter Green
- 5079 Argyle Dr
- 8134 Hunter Green
- 5083 Argyle Dr
- 8143 Hunter Green
- 5067 Argyle Dr