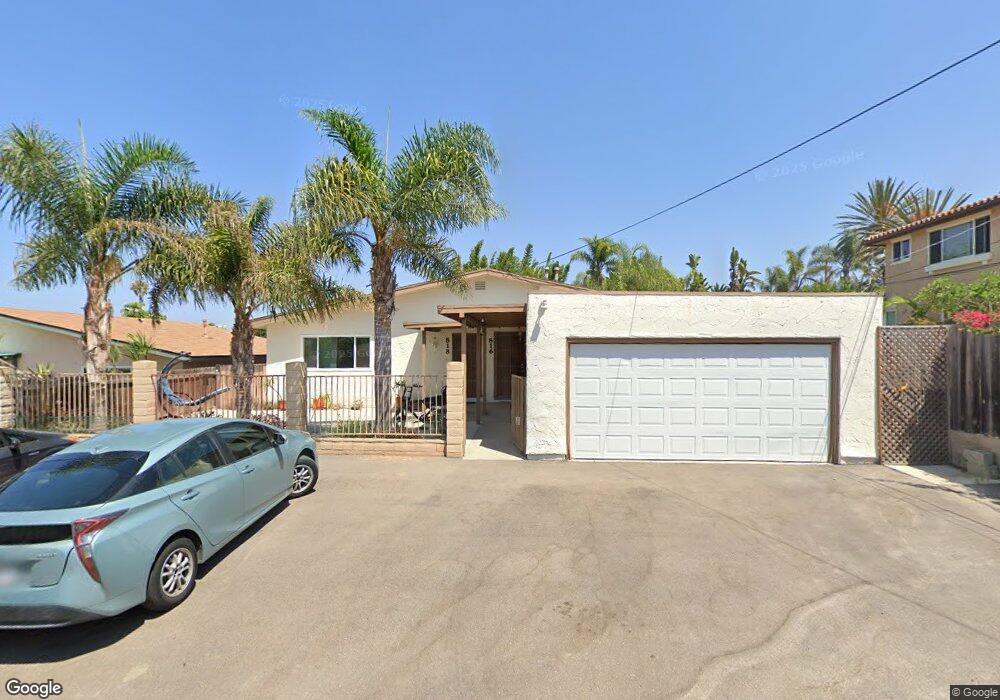
816 Bracero Rd Unit 18 Encinitas, CA 92024
Central Encinitas NeighborhoodEstimated Value: $1,641,000 - $1,934,422
4
Beds
4
Baths
1,850
Sq Ft
$978/Sq Ft
Est. Value
About This Home
This home is located at 816 Bracero Rd Unit 18, Encinitas, CA 92024 and is currently estimated at $1,810,106, approximately $978 per square foot. 816 Bracero Rd Unit 18 is a home located in San Diego County with nearby schools including Ocean Knoll Elementary School, Oak Crest Middle School, and La Costa Canyon High School.
Ownership History
Date
Name
Owned For
Owner Type
Purchase Details
Closed on
Dec 17, 2009
Sold by
Cowen Don Leonard
Bought by
Le Lang and Le Estela Z
Current Estimated Value
Home Financials for this Owner
Home Financials are based on the most recent Mortgage that was taken out on this home.
Original Mortgage
$390,000
Interest Rate
5.03%
Mortgage Type
New Conventional
Purchase Details
Closed on
Sep 23, 2004
Sold by
Cowen Sally R
Bought by
Cowen Don Leonard
Home Financials for this Owner
Home Financials are based on the most recent Mortgage that was taken out on this home.
Original Mortgage
$276,800
Interest Rate
7.3%
Mortgage Type
Unknown
Purchase Details
Closed on
Jul 15, 1999
Sold by
Joseph Orlando
Bought by
Cowen Don L and Cowen Sally R
Home Financials for this Owner
Home Financials are based on the most recent Mortgage that was taken out on this home.
Original Mortgage
$198,100
Interest Rate
10.5%
Mortgage Type
Purchase Money Mortgage
Purchase Details
Closed on
Jan 31, 1991
Create a Home Valuation Report for This Property
The Home Valuation Report is an in-depth analysis detailing your home's value as well as a comparison with similar homes in the area
Home Values in the Area
Average Home Value in this Area
Purchase History
| Date | Buyer | Sale Price | Title Company |
|---|---|---|---|
| Le Lang | -- | Corinthian Title Company | |
| Le Lang | $545,000 | Corinthian Title Company | |
| Cowen Don Leonard | -- | Chicago Title Co | |
| Cowen Don Leonard | -- | -- | |
| Cowen Don L | -- | California Title Company | |
| -- | $220,000 | -- |
Source: Public Records
Mortgage History
| Date | Status | Borrower | Loan Amount |
|---|---|---|---|
| Previous Owner | Le Lang | $390,000 | |
| Previous Owner | Cowen Don Leonard | $276,800 | |
| Previous Owner | Cowen Don L | $198,100 | |
| Closed | Cowen Don L | $47,912 |
Source: Public Records
Tax History
| Year | Tax Paid | Tax Assessment Tax Assessment Total Assessment is a certain percentage of the fair market value that is determined by local assessors to be the total taxable value of land and additions on the property. | Land | Improvement |
|---|---|---|---|---|
| 2025 | $8,431 | $703,479 | $366,371 | $337,108 |
| 2024 | $8,431 | $689,687 | $359,188 | $330,499 |
| 2023 | $8,164 | $676,165 | $352,146 | $324,019 |
| 2022 | $8,135 | $662,908 | $345,242 | $317,666 |
| 2021 | $7,674 | $649,911 | $338,473 | $311,438 |
| 2020 | $7,827 | $643,248 | $335,003 | $308,245 |
| 2019 | $7,684 | $630,636 | $328,435 | $302,201 |
| 2018 | $7,844 | $618,272 | $321,996 | $296,276 |
| 2017 | $7,827 | $606,150 | $315,683 | $290,467 |
| 2016 | $7,685 | $594,266 | $309,494 | $284,772 |
| 2015 | $7,470 | $585,341 | $304,846 | $280,495 |
| 2014 | $7,505 | $573,876 | $298,875 | $275,001 |
Source: Public Records
Map
Nearby Homes
- 760 Bonita Dr
- 1044 Arcadia Rd
- 935 Encinitas Blvd
- 405 Requeza St Unit H9
- 407 Requeza St Unit E9
- 1010 Scarlet Way
- 1011 Monterey Vista Way
- 1025 Monterey Vista Way
- 800 Encinitas Blvd Unit 104
- 224 Seeman Dr
- 545 Quail Pointe Ln
- 733 Cathy Ln
- 548 Quail Pointe Ln
- 155 Rosebay Dr Unit 37
- 0 Crest Dr Unit 250045003
- 1280 Santa fe Dr
- 1180 Devonshire Dr
- 1503 Villa Cardiff Dr
- 262 Coneflower St
- 1386 Lake Dr
- 820 Bracero Rd
- 820 & 822 Bracero Rd
- 812 Bracero Rd
- 860 Bracero Rd
- 826 Bracero Rd
- 790 Bracero Rd
- 778 Bracero Rd
- 886 Bracero Rd
- 769 Nardo Rd Unit 71
- 751 Nardo Rd
- 752 Bracero Rd
- 890 Bracero Rd
- 732 Herder Ln
- 896 Bracero Rd
- 755 Nardo Rd
- 743 Bracero Rd
- 825 Nardo Rd
- 829 Bracero Rd
- 743 Nardo Rd
- 805 Bracero Rd
Your Personal Tour Guide
Ask me questions while you tour the home.