Estimated Value: $282,267 - $305,000
3
Beds
2
Baths
1,582
Sq Ft
$188/Sq Ft
Est. Value
About This Home
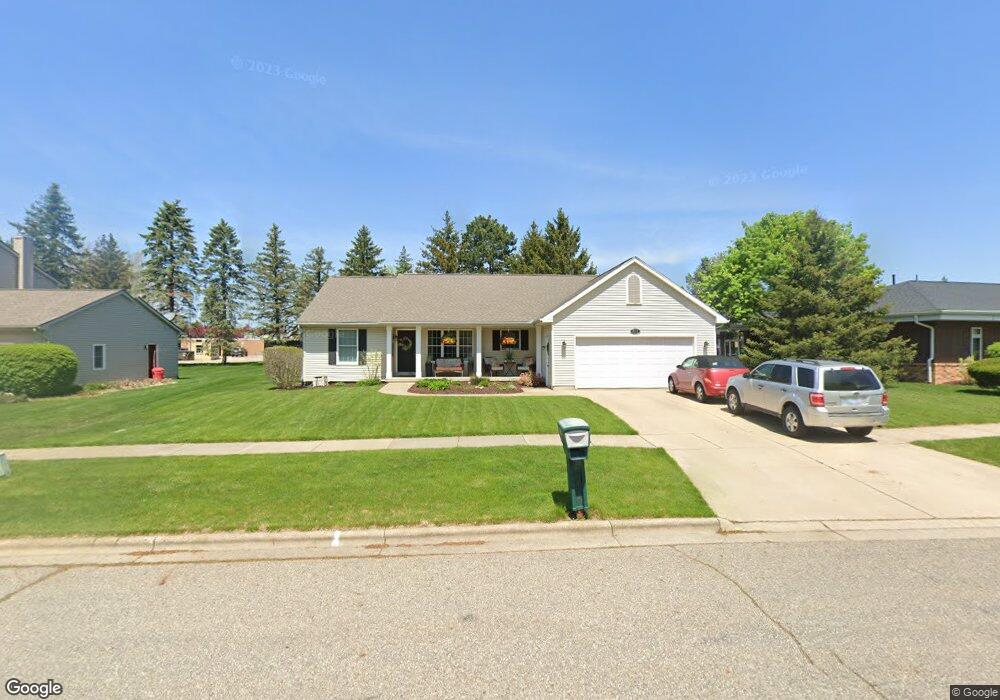
This home is located at 817 Cindy St, Mason, MI 48854 and is currently estimated at $297,067, approximately $187 per square foot. 817 Cindy St is a home located in Ingham County with nearby schools including Mason High School.
Ownership History
Date
Name
Owned For
Owner Type
Purchase Details
Closed on
Feb 10, 1998
Sold by
Bondarenko Nena O
Bought by
Delbridge Lance and Delbridge Christina
Current Estimated Value
Purchase Details
Closed on
Jul 9, 1996
Sold by
Minshall Kerry J and Minshall Kerri L
Bought by
Bondarenko Nena O
Purchase Details
Closed on
Nov 6, 1991
Sold by
Minsh Kerry J and Minsh Kerri L
Create a Home Valuation Report for This Property
The Home Valuation Report is an in-depth analysis detailing your home's value as well as a comparison with similar homes in the area
Home Values in the Area
Average Home Value in this Area
Purchase History
| Date | Buyer | Sale Price | Title Company |
|---|---|---|---|
| Delbridge Lance | $157,400 | -- | |
| Bondarenko Nena O | $27,000 | -- | |
| -- | $25,000 | -- |
Source: Public Records
Tax History
| Year | Tax Paid | Tax Assessment Tax Assessment Total Assessment is a certain percentage of the fair market value that is determined by local assessors to be the total taxable value of land and additions on the property. | Land | Improvement |
|---|---|---|---|---|
| 2025 | $5,792 | $147,700 | $31,190 | $116,510 |
| 2024 | $5,433 | $138,720 | $31,190 | $107,530 |
| 2023 | $5,433 | $138,590 | $28,720 | $109,870 |
| 2022 | $5,180 | $124,170 | $29,190 | $94,980 |
| 2021 | $5,037 | $118,450 | $29,190 | $89,260 |
| 2020 | $4,891 | $105,050 | $29,190 | $75,860 |
| 2019 | $4,719 | $102,370 | $22,940 | $79,430 |
| 2018 | $4,635 | $103,950 | $20,850 | $83,100 |
| 2017 | $4,198 | $103,950 | $20,850 | $83,100 |
| 2016 | -- | $95,200 | $10,840 | $84,360 |
| 2015 | -- | $84,940 | $21,684 | $63,256 |
| 2014 | -- | $82,040 | $35,445 | $46,595 |
Source: Public Records
Map
Nearby Homes
- 202 Stratford Dr
- 614 Ann St Unit 25
- 704 Hall Blvd
- 584 Vanderveen Dr
- 0 Sanctuary
- 422 Ann St
- 334 E Elm St
- 537 Vanderveen Dr
- 404 E Cherry St
- 32 Aviemore Dr Unit 32
- 833 S Barnes St
- 514 W Maple St
- 318 Ives Rd
- 307 Ives Rd
- 990 Windjammer Ct
- 501 Middlebury Ln
- 1470 N Cedar St
- 106 Carom Cir
- 105 Carom Cir
- 311 Carom Cir Unit 59
- 809 Cindy St
- 816 Cindy St
- 808 Cindy St
- 803 Cindy St
- 824 Cindy St
- 237 Washington St
- 832 Cindy St
- 809 E Maple St
- 821 E Maple St
- 249 Washington St
- 831 E Maple St
- 226 Washington St
- 216 Washington St
- 234 Washington St
- 210 Washington St
- 204 Washington St
- 248 Washington St
- 227 Mark St
- 215 Mark St
- 820 E Maple St
Your Personal Tour Guide
Ask me questions while you tour the home.