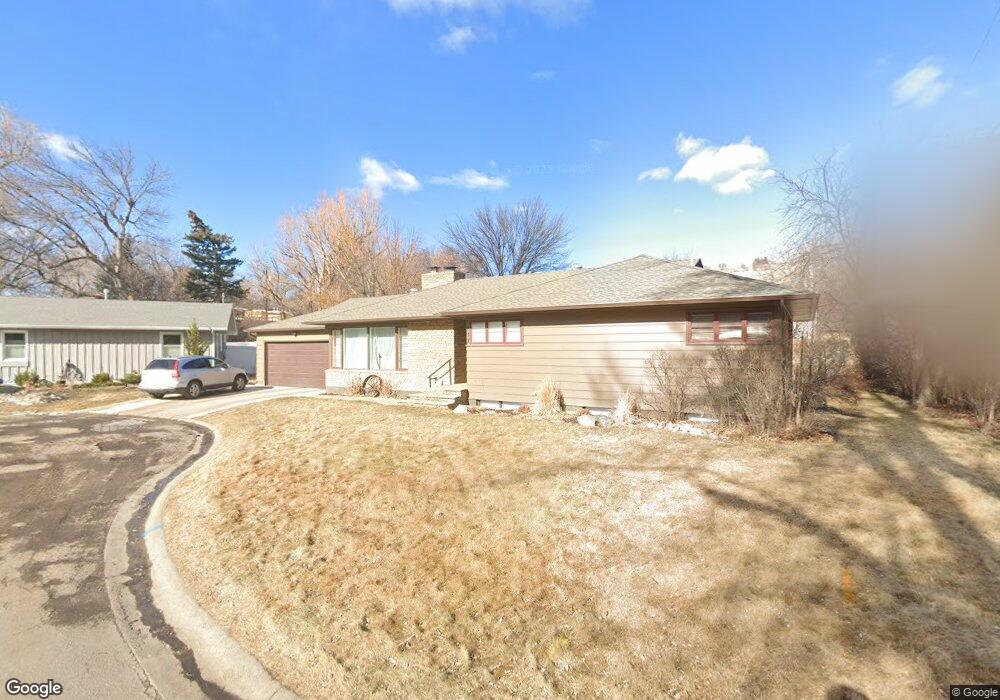
817 Highwood Cir Billings, MT 59102
Hilands NeighborhoodEstimated Value: $414,000 - $465,000
4
Beds
2
Baths
2,234
Sq Ft
$197/Sq Ft
Est. Value
About This Home
This home is located at 817 Highwood Cir, Billings, MT 59102 and is currently estimated at $439,845, approximately $196 per square foot. 817 Highwood Cir is a home located in Yellowstone County with nearby schools including Highland Elementary School, Lewis & Clark Junior High School, and Billings Senior High School.
Ownership History
Date
Name
Owned For
Owner Type
Purchase Details
Closed on
Jul 12, 2021
Sold by
Robertus Mark W and Robertus Gay Lynn
Bought by
Barry David and Barry Sadie
Current Estimated Value
Home Financials for this Owner
Home Financials are based on the most recent Mortgage that was taken out on this home.
Original Mortgage
$262,400
Outstanding Balance
$238,087
Interest Rate
2.9%
Mortgage Type
New Conventional
Estimated Equity
$201,758
Purchase Details
Closed on
Mar 30, 2021
Sold by
Scherer Leigh N and Wilson Leigh N
Bought by
Robertus Mark W and Robertus Gay Lynn
Purchase Details
Closed on
May 21, 2013
Sold by
Hofferber Mike and Stapleton Todd
Bought by
Scherer Jason M
Home Financials for this Owner
Home Financials are based on the most recent Mortgage that was taken out on this home.
Original Mortgage
$231,600
Interest Rate
3.41%
Mortgage Type
New Conventional
Purchase Details
Closed on
Aug 31, 2012
Sold by
Neiter Timothy O
Bought by
Hofferber Mike and Stapleton Todd
Create a Home Valuation Report for This Property
The Home Valuation Report is an in-depth analysis detailing your home's value as well as a comparison with similar homes in the area
Home Values in the Area
Average Home Value in this Area
Purchase History
| Date | Buyer | Sale Price | Title Company |
|---|---|---|---|
| Barry David | -- | Chicago Title | |
| Robertus Mark W | -- | Chicago Title | |
| Scherer Jason M | -- | None Available | |
| Hofferber Mike | -- | None Available |
Source: Public Records
Mortgage History
| Date | Status | Borrower | Loan Amount |
|---|---|---|---|
| Open | Barry David | $262,400 | |
| Previous Owner | Scherer Jason M | $231,600 |
Source: Public Records
Tax History Compared to Growth
Tax History
| Year | Tax Paid | Tax Assessment Tax Assessment Total Assessment is a certain percentage of the fair market value that is determined by local assessors to be the total taxable value of land and additions on the property. | Land | Improvement |
|---|---|---|---|---|
| 2025 | $3,353 | $440,400 | $49,840 | $390,560 |
| 2024 | $3,353 | $343,700 | $47,498 | $296,202 |
| 2023 | $3,346 | $343,700 | $47,498 | $296,202 |
| 2022 | $3,268 | $302,400 | $44,620 | $257,780 |
| 2021 | $3,109 | $302,400 | $0 | $0 |
| 2020 | $2,997 | $278,500 | $0 | $0 |
| 2019 | $3,004 | $293,600 | $0 | $0 |
| 2018 | $2,543 | $241,200 | $0 | $0 |
| 2017 | $2,471 | $241,200 | $0 | $0 |
| 2016 | $2,331 | $229,800 | $0 | $0 |
| 2015 | $2,279 | $229,800 | $0 | $0 |
| 2014 | $1,998 | $106,583 | $0 | $0 |
Source: Public Records
Map
Nearby Homes
- 920 Yale Ave
- 2914 Rimview Dr
- 1028 Princeton Ave
- 934 Delphinium Dr
- 803 Parkhill Dr
- 813 Avenue F
- 1214 Harvard Ave
- 1121 Parkhill Dr
- 1034 Avenue F
- 1124 Parkhill Dr
- 511 Avenue F
- 2207 Pine St
- 2202 13th St W
- 2415 Ash St
- 509 Avenue E
- 1400 Poly Dr Unit 4D
- 41 Heatherwood Ln
- 1313 Granite Ave
- 310 Beverly Hill Blvd
- 1323 Granite Ave
- 816 Circle Dr
- 823 Highwood Cir
- 820 Circle Dr
- 818 Highwood Cir
- 2608 Highwood Dr
- 824 Highwood Cir
- 2614 Highwood Dr
- 2614 Highwood Dr Unit South
- 2614 Highwood Dr Unit Main
- 2607 Glenwood Ln
- 810 Highwood Cir
- 2601 Glenwood Ln
- 2611 Glenwood Ln
- 827 Circle Dr
- 815 Circle Dr
- 6805 Sandy Spring Cir
- 2525 Glenwood Ln
- 2617 Glenwood Ln
- 2620 Highwood Dr
- 819 Poly Dr