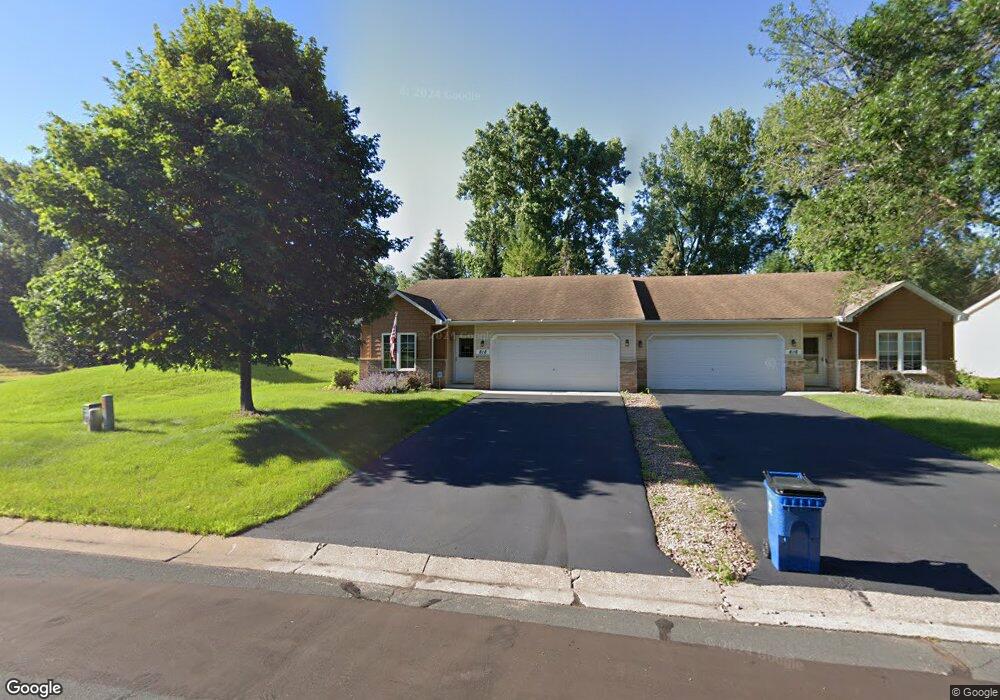
818 Garceau Ln Saint Paul, MN 55127
Estimated Value: $297,618 - $327,000
2
Beds
2
Baths
1,536
Sq Ft
$204/Sq Ft
Est. Value
About This Home
This home is located at 818 Garceau Ln, Saint Paul, MN 55127 and is currently estimated at $313,905, approximately $204 per square foot. 818 Garceau Ln is a home located in Ramsey County with nearby schools including Vadnais Heights Elementary School, Sunrise Park Middle School, and AFSA High School.
Ownership History
Date
Name
Owned For
Owner Type
Purchase Details
Closed on
May 28, 2021
Sold by
Walfoort William and Walfoort Alice
Bought by
Walfoort Lisa
Current Estimated Value
Home Financials for this Owner
Home Financials are based on the most recent Mortgage that was taken out on this home.
Original Mortgage
$165,000
Outstanding Balance
$125,278
Interest Rate
2.9%
Mortgage Type
New Conventional
Estimated Equity
$188,627
Purchase Details
Closed on
Sep 30, 2015
Sold by
Button James W and Button Madelon A
Bought by
Walfoort William and Walfoort Alice
Purchase Details
Closed on
Aug 31, 2011
Sold by
House Mildred E
Bought by
Button James W and Button Madelon A
Purchase Details
Closed on
Sep 24, 2004
Sold by
Tarshis Mira
Bought by
House William A and House Mildred E
Purchase Details
Closed on
Oct 22, 2002
Bought by
Tarsies Mira
Purchase Details
Closed on
Mar 10, 1998
Sold by
Goff Homes Inc
Bought by
Bennett Robert M and Bennett Hazel M
Create a Home Valuation Report for This Property
The Home Valuation Report is an in-depth analysis detailing your home's value as well as a comparison with similar homes in the area
Home Values in the Area
Average Home Value in this Area
Purchase History
| Date | Buyer | Sale Price | Title Company |
|---|---|---|---|
| Walfoort Lisa | $250,000 | Land Title Inc | |
| Walfoort William | $199,900 | Title Recording Services Inc | |
| Button James W | $150,000 | -- | |
| House William A | $249,900 | -- | |
| Tarsies Mira | $195,000 | -- | |
| Bennett Robert M | $139,135 | -- | |
| Walfoort Lisa Lisa | $250,000 | -- |
Source: Public Records
Mortgage History
| Date | Status | Borrower | Loan Amount |
|---|---|---|---|
| Open | Walfoort Lisa | $165,000 | |
| Closed | Walfoort Lisa Lisa | $160,194 |
Source: Public Records
Tax History
| Year | Tax Paid | Tax Assessment Tax Assessment Total Assessment is a certain percentage of the fair market value that is determined by local assessors to be the total taxable value of land and additions on the property. | Land | Improvement |
|---|---|---|---|---|
| 2025 | $3,880 | $303,800 | $70,200 | $233,600 |
| 2023 | $3,880 | $302,400 | $70,200 | $232,200 |
| 2022 | $3,488 | $307,600 | $70,200 | $237,400 |
| 2021 | $3,402 | $263,200 | $70,200 | $193,000 |
| 2020 | $3,514 | $264,900 | $70,200 | $194,700 |
| 2019 | $2,552 | $255,400 | $29,300 | $226,100 |
| 2018 | $2,490 | $204,300 | $29,300 | $175,000 |
| 2017 | $2,458 | $202,300 | $29,300 | $173,000 |
| 2016 | $2,452 | $0 | $0 | $0 |
| 2015 | $2,240 | $187,100 | $29,300 | $157,800 |
| 2014 | $2,546 | $0 | $0 | $0 |
Source: Public Records
Map
Nearby Homes
- 760 Garceau Ln
- 768 Hiawatha Ave
- 698 Bibeau Ct
- 789 Parkside Dr Unit 789G
- 3306 Greenbrier St Unit 3306D
- 3286 Greenbrier St Unit 3286C
- 963 E Berwood Ave
- 696 Monn Ave
- 3590 Searle Ct
- 3268 Edgerton St
- 3282 Edgerton St Unit 3282
- 675 Koehler Rd
- 3555 Edgerton St
- 3230 Edgerton St
- 3080 Greenbrier St
- 3677 Edgerton St
- 832 Aspen Cir
- 3003 Greenbrier St
- 3089 Cedar St
- 3087 Cedar St
- 818 818 Garceau Ln
- 816 Garceau Ln
- 808 Garceau Ln
- 819 Hiawatha Ave
- 806 Garceau Ln
- 801 Hiawatha Ave
- 819 Garceau Ln
- 817 Garceau Ln
- 825 Garceau Ln
- 799 Hiawatha Ave
- 798 Garceau Ln
- 809 Garceau Ln
- 809 809 Garceau Ln
- 807 Garceau Ln
- 827 Garceau Ln
- 796 Garceau Ln
- 793 Hiawatha Ave
- 796 796 Garceau Ln
- 0 Garceau Ln
- 799 Garceau Ln
Your Personal Tour Guide
Ask me questions while you tour the home.