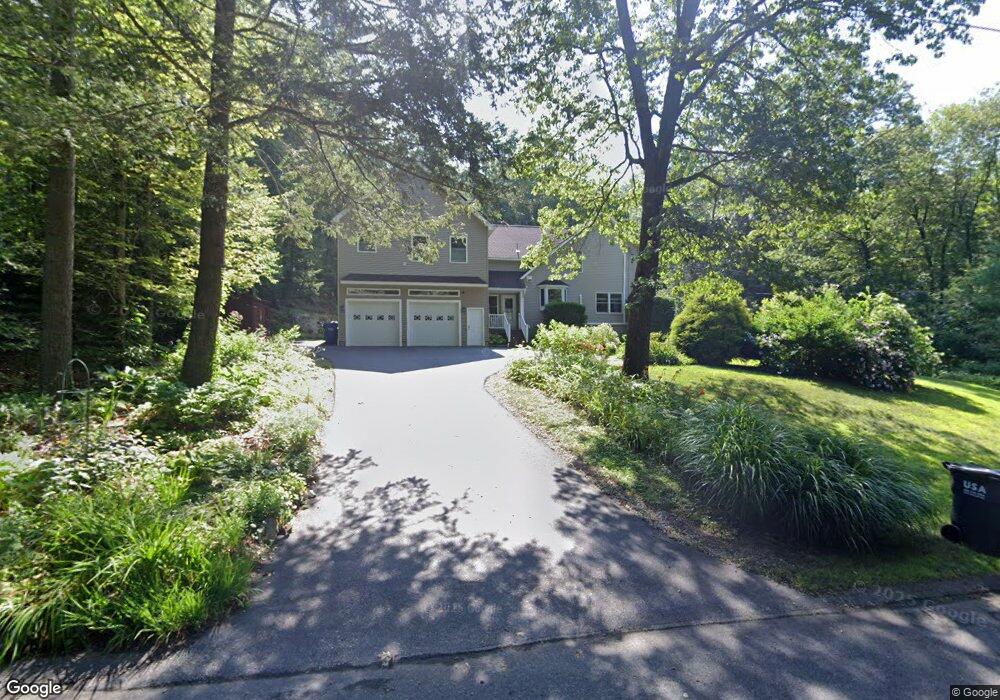
82 N Mountain Rd Sunderland, MA 01375
Estimated Value: $496,000 - $662,000
3
Beds
2
Baths
1,750
Sq Ft
$319/Sq Ft
Est. Value
About This Home
This home is located at 82 N Mountain Rd, Sunderland, MA 01375 and is currently estimated at $559,096, approximately $319 per square foot. 82 N Mountain Rd is a home located in Franklin County with nearby schools including Sunderland Elementary School and Frontier Regional School.
Ownership History
Date
Name
Owned For
Owner Type
Purchase Details
Closed on
Dec 3, 2025
Sold by
Williams Robert and Williams Barbara E
Bought by
Carr-Mal Niranjan and Carr-Mal Michelle
Current Estimated Value
Purchase Details
Closed on
Sep 22, 2004
Sold by
Carr-Mal Niranjan
Bought by
Carr-Mal Niranjan and Carr-Mal Michelle
Home Financials for this Owner
Home Financials are based on the most recent Mortgage that was taken out on this home.
Original Mortgage
$20,000
Interest Rate
6.16%
Purchase Details
Closed on
Jun 19, 2001
Sold by
Burgess Stephen and Burgess Michelle A
Bought by
Carr Michelle and Mal Niranjan Kumar
Home Financials for this Owner
Home Financials are based on the most recent Mortgage that was taken out on this home.
Original Mortgage
$135,000
Interest Rate
7.15%
Mortgage Type
Purchase Money Mortgage
Purchase Details
Closed on
Mar 1, 1999
Sold by
Segal Yvette
Bought by
Burgess Stpehen and Burgess Michelle A
Purchase Details
Closed on
Oct 19, 1995
Sold by
Farrick Irene P and Farrick Ralph K
Bought by
Segal Yvette L
Create a Home Valuation Report for This Property
The Home Valuation Report is an in-depth analysis detailing your home's value as well as a comparison with similar homes in the area
Home Values in the Area
Average Home Value in this Area
Purchase History
| Date | Buyer | Sale Price | Title Company |
|---|---|---|---|
| Carr-Mal Niranjan | $170,000 | -- | |
| Carr-Mal Niranjan | -- | -- | |
| Carr Michelle | $185,000 | -- | |
| Burgess Stpehen | $165,000 | -- | |
| Segal Yvette L | $35,000 | -- |
Source: Public Records
Mortgage History
| Date | Status | Borrower | Loan Amount |
|---|---|---|---|
| Previous Owner | Segal Yvette L | $119,000 | |
| Previous Owner | Segal Yvette L | $20,000 | |
| Previous Owner | Segal Yvette L | $135,000 |
Source: Public Records
Tax History
| Year | Tax Paid | Tax Assessment Tax Assessment Total Assessment is a certain percentage of the fair market value that is determined by local assessors to be the total taxable value of land and additions on the property. | Land | Improvement |
|---|---|---|---|---|
| 2025 | $6,006 | $461,300 | $123,300 | $338,000 |
| 2024 | $6,061 | $461,300 | $123,300 | $338,000 |
| 2023 | $5,432 | $424,400 | $102,500 | $321,900 |
| 2022 | $5,482 | $372,900 | $88,000 | $284,900 |
| 2021 | $5,360 | $346,000 | $82,600 | $263,400 |
| 2020 | $5,339 | $345,800 | $82,600 | $263,200 |
| 2019 | $4,412 | $287,800 | $80,000 | $207,800 |
| 2018 | $4,145 | $276,300 | $76,800 | $199,500 |
| 2017 | $3,958 | $276,000 | $79,100 | $196,900 |
| 2016 | $3,911 | $266,800 | $77,500 | $189,300 |
| 2015 | $3,802 | $265,700 | $77,500 | $188,200 |
| 2014 | $3,714 | $265,700 | $77,500 | $188,200 |
Source: Public Records
Map
Nearby Homes
- 37 River Rd
- 15 Crestview Dr
- 18 Stage Rd
- 0 Pocumtuck Dr Unit 73379330
- 14 Sugarloaf St
- 26 S Main St
- 435 Montague Rd
- 24 Elm St
- 10 Depot Rd
- 0 Greenfield Rd Unit 73472322
- 355 Greenfield Rd
- 208 Greenfield Rd
- 90 Whately Rd
- 15 S Plain Rd
- 100 Depot Rd
- 345 Greenfield Rd
- 13 Shattuck Rd
- 35 A N Leverett Rd
- 66 Cave Hill Rd
- 113 Juggler Meadow Rd
- 3 Bears Den Dr
- 88 N Mountain Rd
- 10 Bears Den Dr
- 22 Bears Den Dr
- 67 N Mountain Rd
- 22 Bear's Den Dr
- 32 N Bears Den Dr
- 23 N Bears Den Dr
- 211 Claybrook Rd
- 9 N Bears Den Dr
- 62 Claybrook Rd
- 63 Claybrook Rd
- 56 Claybrook Rd
- 6 N Bears Den Dr
- 31 Bears Den Dr
- 78 Bears Den Dr
- 82 Claybrook Rd
- 14 N Bears Den Dr
- 40 Claybrook Rd
- 60 Bears Den Dr
Your Personal Tour Guide
Ask me questions while you tour the home.