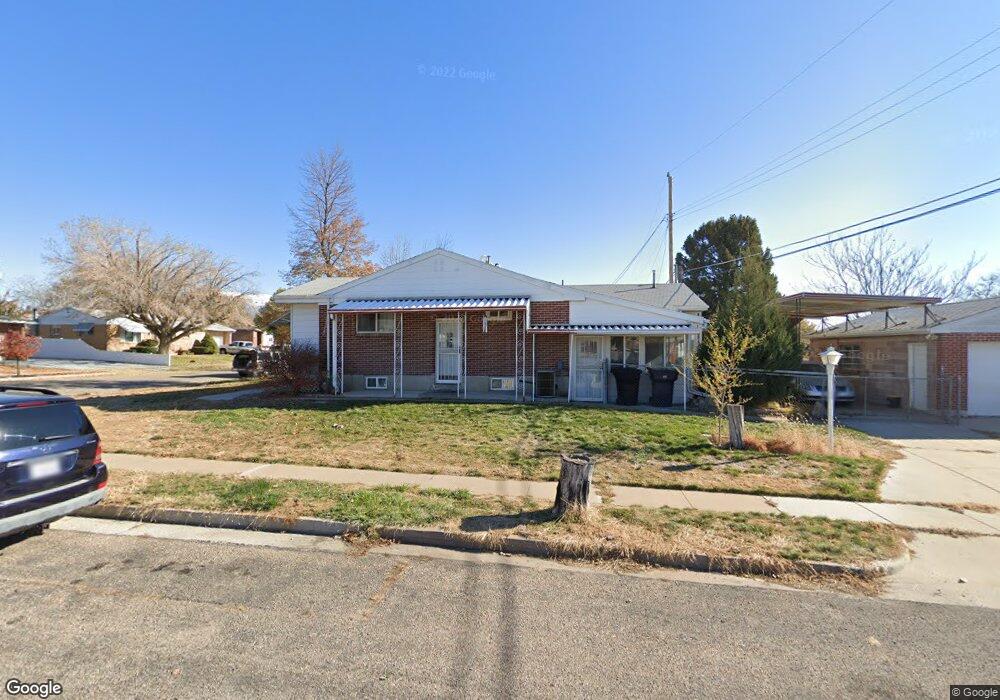
82 Sycamore Cir Clearfield, UT 84015
Estimated Value: $400,000 - $443,000
4
Beds
2
Baths
2,620
Sq Ft
$162/Sq Ft
Est. Value
About This Home
This home is located at 82 Sycamore Cir, Clearfield, UT 84015 and is currently estimated at $424,745, approximately $162 per square foot. 82 Sycamore Cir is a home located in Davis County with nearby schools including Wasatch Elementary School, North Davis Junior High School, and Clearfield High School.
Ownership History
Date
Name
Owned For
Owner Type
Purchase Details
Closed on
Nov 3, 2020
Sold by
Oliphant Darian Adrian
Bought by
Oliphant Darian Adrian and Oliphant Lauren
Current Estimated Value
Home Financials for this Owner
Home Financials are based on the most recent Mortgage that was taken out on this home.
Original Mortgage
$247,500
Outstanding Balance
$220,138
Interest Rate
2.9%
Mortgage Type
New Conventional
Estimated Equity
$204,607
Purchase Details
Closed on
Jun 28, 2019
Sold by
Oliphant Darian
Bought by
Oliphant Darian and Oliphant Laureen
Home Financials for this Owner
Home Financials are based on the most recent Mortgage that was taken out on this home.
Original Mortgage
$242,500
Interest Rate
4%
Mortgage Type
New Conventional
Purchase Details
Closed on
Dec 15, 2008
Sold by
Landes Glenna Mae
Bought by
Rayl Blaine C and Rayl Anna M
Create a Home Valuation Report for This Property
The Home Valuation Report is an in-depth analysis detailing your home's value as well as a comparison with similar homes in the area
Home Values in the Area
Average Home Value in this Area
Purchase History
| Date | Buyer | Sale Price | Title Company |
|---|---|---|---|
| Oliphant Darian Adrian | -- | Accommodation | |
| Otiphant Darian Adrian | -- | Backman Title Services | |
| Oliphant Darian | -- | Integrated Ttl Ins Svcs Llc | |
| Oliphant Darian | -- | Integrated Title Ins | |
| Rayl Blaine C | -- | Us Title Company Of Utah |
Source: Public Records
Mortgage History
| Date | Status | Borrower | Loan Amount |
|---|---|---|---|
| Open | Otiphant Darian Adrian | $247,500 | |
| Previous Owner | Oliphant Darian | $242,500 |
Source: Public Records
Tax History
| Year | Tax Paid | Tax Assessment Tax Assessment Total Assessment is a certain percentage of the fair market value that is determined by local assessors to be the total taxable value of land and additions on the property. | Land | Improvement |
|---|---|---|---|---|
| 2025 | $2,578 | $231,000 | $82,582 | $148,418 |
| 2024 | $2,492 | $224,950 | $78,501 | $146,449 |
| 2023 | $2,318 | $384,000 | $124,581 | $259,419 |
| 2022 | $2,216 | $198,550 | $70,463 | $128,087 |
| 2021 | $1,972 | $267,000 | $80,178 | $186,822 |
| 2020 | $1,711 | $230,000 | $68,467 | $161,533 |
| 2019 | $1,680 | $223,000 | $67,993 | $155,007 |
| 2018 | $1,516 | $196,000 | $56,940 | $139,060 |
| 2016 | $1,419 | $95,920 | $24,465 | $71,455 |
| 2015 | $1,357 | $87,450 | $24,465 | $62,985 |
| 2014 | $1,341 | $87,595 | $24,465 | $63,130 |
| 2013 | -- | $61,909 | $29,935 | $31,974 |
Source: Public Records
Map
Nearby Homes
- 328 E 100 N
- 15 S 400 E
- 51 S 400 E
- 206 E 100 N
- 338 E 200 S
- 246 E 200 S
- 527 E 250 S
- 288 S 500 E Unit 1
- 75 E Hamblin Ln Unit 141
- 70 E Weekes Way
- 66 E 200 S Unit 108
- 446 Fern Dr
- 285 N Main St Unit 308
- 54 W 250 N
- 582 E 350 S
- 75 W 250 N Unit 78
- 75 W 250 N Unit 31
- 75 W 250 N Unit 110
- 75 W 250 N Unit 56
- 75 W 250 N Unit 84
- 70 Sycamore Cir
- 104 Sycamore Cir
- 56 Sycamore Cir
- 79 Sycamore Cir
- 116 Sycamore Cir
- 377 Center St
- 93 Sycamore Cir
- 65 Sycamore Cir
- 328 E 100 N Unit 37-38
- 369 Center St
- 393 Center St
- 107 Sycamore Cir
- 355 Center St
- 44 Sycamore Cir
- 342 E 100 N
- 385 Center St
- 47 Sycamore Cir
- 125 Sycamore Cir
- 403 Center St
- 111 Lynwood Dr
Your Personal Tour Guide
Ask me questions while you tour the home.