Estimated Value: $152,000 - $178,100
4
Beds
3
Baths
1,552
Sq Ft
$105/Sq Ft
Est. Value
About This Home
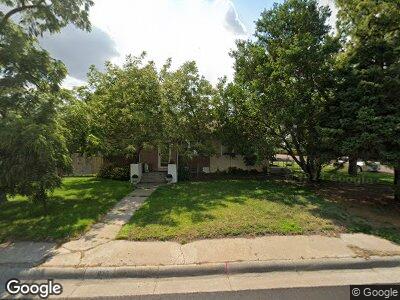
This home is located at 820 S Grant Ave, Colby, KS 67701 and is currently estimated at $162,700, approximately $104 per square foot. 820 S Grant Ave is a home located in Thomas County with nearby schools including Colby Elementary School, Colby Middle School, and Colby Senior High School.
Create a Home Valuation Report for This Property
The Home Valuation Report is an in-depth analysis detailing your home's value as well as a comparison with similar homes in the area
Home Values in the Area
Average Home Value in this Area
Tax History Compared to Growth
Tax History
| Year | Tax Paid | Tax Assessment Tax Assessment Total Assessment is a certain percentage of the fair market value that is determined by local assessors to be the total taxable value of land and additions on the property. | Land | Improvement |
|---|---|---|---|---|
| 2024 | $24 | $15,603 | $1,785 | $13,818 |
| 2023 | $2,385 | $14,873 | $1,665 | $13,208 |
| 2022 | $2,060 | $14,302 | $1,785 | $12,517 |
| 2021 | $2,060 | $13,492 | $1,104 | $12,388 |
| 2020 | $2,060 | $13,099 | $1,104 | $11,995 |
| 2019 | $2,149 | $13,099 | $1,104 | $11,995 |
| 2018 | $2,213 | $13,099 | $1,104 | $11,995 |
| 2017 | $2,240 | $13,099 | $1,104 | $11,995 |
| 2016 | $2,180 | $12,837 | $1,104 | $11,733 |
| 2015 | -- | $10,925 | $950 | $9,975 |
| 2014 | -- | $8,425 | $950 | $7,475 |
Source: Public Records
Map
Nearby Homes
- 905 S Range Ave
- 315 E Walnut St
- 655 N Lincoln Ave
- 875 W 7th St
- 0 Walking Trail Ln
- 1750 Sewell Ave
- 935 E 5th St
- 880 N Thompson Ave
- 2915 N Range Ave
- 5245 N Range Ave
- 356 County Road K
- 1492 County Road 2
- 0 County Rd E
- 000 NW 4 7-11-34 Logan Co Ks
- 703 Wink Ave
- 415 Cherry Ave
- 419 Colby Ave
- 3053 County Road A
- 00000 Road 110 W