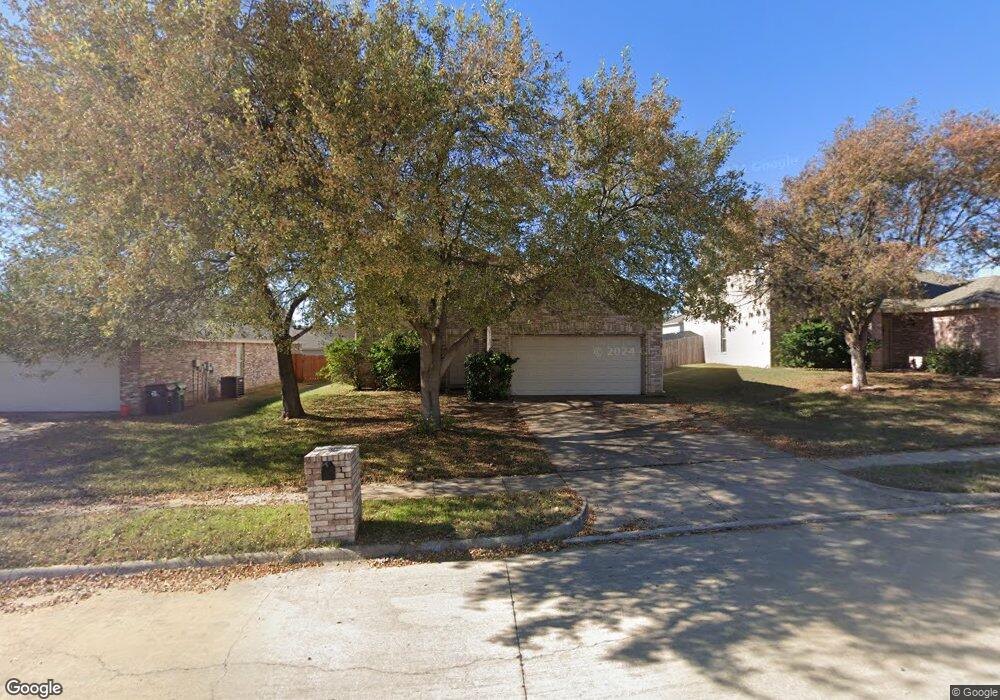
8208 Clear River Ln Denton, TX 76210
South Denton NeighborhoodEstimated Value: $354,000 - $385,000
4
Beds
3
Baths
2,611
Sq Ft
$141/Sq Ft
Est. Value
About This Home
This home is located at 8208 Clear River Ln, Denton, TX 76210 and is currently estimated at $369,115, approximately $141 per square foot. 8208 Clear River Ln is a home located in Denton County with nearby schools including McNair Elementary School, Harpool Middle School, and Guyer High School.
Ownership History
Date
Name
Owned For
Owner Type
Purchase Details
Closed on
Aug 29, 2011
Sold by
U S Bank National Association
Bought by
Johnson Charles and Johnson Patricia
Current Estimated Value
Purchase Details
Closed on
Apr 5, 2011
Sold by
Brooks Julie and Brooks Dennis
Bought by
U S Bank National Association
Purchase Details
Closed on
May 5, 2006
Sold by
Perovich Paul T and Perovich Sue
Bought by
Brooks Julie
Home Financials for this Owner
Home Financials are based on the most recent Mortgage that was taken out on this home.
Original Mortgage
$116,000
Interest Rate
6.36%
Mortgage Type
Purchase Money Mortgage
Purchase Details
Closed on
Jan 30, 2001
Sold by
Centex Homes
Bought by
Perovich Paul T and Perovich Sue
Home Financials for this Owner
Home Financials are based on the most recent Mortgage that was taken out on this home.
Original Mortgage
$135,833
Interest Rate
7.21%
Mortgage Type
VA
Create a Home Valuation Report for This Property
The Home Valuation Report is an in-depth analysis detailing your home's value as well as a comparison with similar homes in the area
Home Values in the Area
Average Home Value in this Area
Purchase History
| Date | Buyer | Sale Price | Title Company |
|---|---|---|---|
| Johnson Charles | -- | None Available | |
| U S Bank National Association | $104,868 | None Available | |
| Brooks Julie | -- | None Available | |
| Perovich Paul T | -- | -- |
Source: Public Records
Mortgage History
| Date | Status | Borrower | Loan Amount |
|---|---|---|---|
| Previous Owner | Brooks Julie | $116,000 | |
| Previous Owner | Perovich Paul T | $135,833 |
Source: Public Records
Tax History Compared to Growth
Tax History
| Year | Tax Paid | Tax Assessment Tax Assessment Total Assessment is a certain percentage of the fair market value that is determined by local assessors to be the total taxable value of land and additions on the property. | Land | Improvement |
|---|---|---|---|---|
| 2025 | $7,242 | $379,601 | $76,928 | $302,673 |
| 2024 | $7,242 | $375,179 | $76,928 | $298,251 |
| 2023 | $7,122 | $373,000 | $76,928 | $296,072 |
| 2022 | $6,836 | $322,000 | $76,928 | $245,072 |
| 2021 | $5,312 | $238,955 | $50,085 | $188,870 |
| 2020 | $5,349 | $234,000 | $55,650 | $178,350 |
| 2019 | $5,369 | $225,000 | $55,650 | $169,350 |
| 2018 | $4,831 | $200,000 | $44,683 | $155,317 |
| 2017 | $4,202 | $170,000 | $44,683 | $125,317 |
| 2016 | $4,107 | $160,000 | $34,470 | $125,530 |
| 2015 | $3,253 | $140,000 | $34,470 | $105,530 |
| 2013 | -- | $125,000 | $34,000 | $91,000 |
Source: Public Records
Map
Nearby Homes
- 1217 Golden Sand Dr
- 8404 Glen Falls Ln
- 7912 Hidden Path Ln
- 8704 Serenity Way
- 7804 Hidden Path Ln
- 1612 Marble Cove Ln
- 1201 Buena Vista Dr
- 8813 Swan Park Dr
- 7620 Waterside Place
- 1617 Glendora Ct
- 1605 Cordero Ct
- 7305 Mira Vista Dr
- 2109 Doecrest Dr
- 7301 Chaucer Dr
- 7100 Frost Ln
- 7121 Raintree Way
- 8204 Montecito Dr
- 2067 Leatherwood Ln
- 2109 Hemingway Dr
- 1569 Stanford Ct
- 8212 Clear River Ln
- 8204 Clear River Ln
- 8205 Canoe Ridge Ln
- 8216 Clear River Ln
- 8201 Canoe Ridge Ln
- 8200 Clear River Ln
- 8209 Canoe Ridge Ln
- 8109 Canoe Ridge Ln
- 8213 Canoe Ridge Ln
- 8205 Clear River Ln
- 8209 Clear River Ln
- 8213 Clear River Ln
- 8105 Canoe Ridge Ln
- 8112 Clear River Ln
- 8113 Clear River Ln
- 8217 Clear River Ln
- 8101 Canoe Ridge Ln
- 8108 Clear River Ln
- 8221 Clear River Ln
- 8105 Clear River Ln