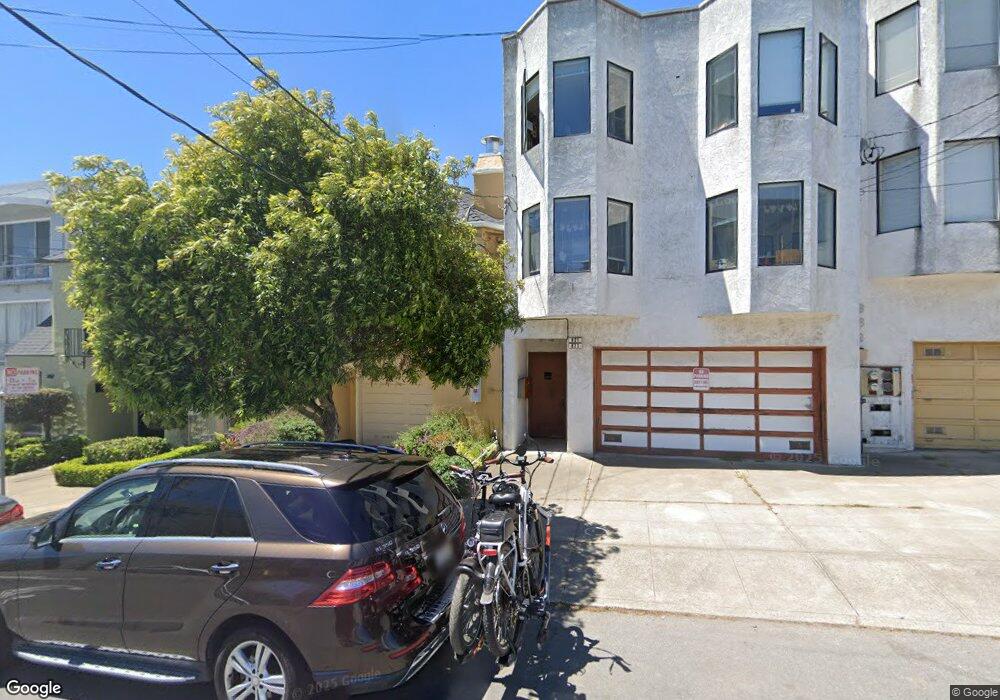
821 36th Ave Unit 823 San Francisco, CA 94121
Outer Richmond NeighborhoodEstimated Value: $1,473,000 - $1,911,000
--
Bed
--
Bath
3,136
Sq Ft
$547/Sq Ft
Est. Value
About This Home
This home is located at 821 36th Ave Unit 823, San Francisco, CA 94121 and is currently estimated at $1,714,120, approximately $546 per square foot. 821 36th Ave Unit 823 is a home located in San Francisco County with nearby schools including Lafayette Elementary School, Presidio Middle School, and St. Thomas The Apostle School.
Ownership History
Date
Name
Owned For
Owner Type
Purchase Details
Closed on
May 24, 2017
Sold by
Joe Alfred K
Bought by
Joe Alfred K and Joe Nancy L
Current Estimated Value
Purchase Details
Closed on
Jul 19, 2005
Sold by
Joe Alfred K and Joe Nancy K
Bought by
Chang Constance E and Chang Joe Alfred
Purchase Details
Closed on
Dec 15, 2003
Sold by
Chang Constance E and Chang Joe Alfred
Bought by
Joe Alfred K and Joe Nancy K
Home Financials for this Owner
Home Financials are based on the most recent Mortgage that was taken out on this home.
Original Mortgage
$384,000
Outstanding Balance
$179,056
Interest Rate
5.97%
Mortgage Type
Commercial
Estimated Equity
$1,535,064
Purchase Details
Closed on
May 11, 1994
Sold by
Chang Tsai Chun and Chang Constance E
Bought by
Chang Constance E and Chang Linda
Create a Home Valuation Report for This Property
The Home Valuation Report is an in-depth analysis detailing your home's value as well as a comparison with similar homes in the area
Home Values in the Area
Average Home Value in this Area
Purchase History
| Date | Buyer | Sale Price | Title Company |
|---|---|---|---|
| Joe Alfred K | -- | None Available | |
| Chang Constance E | $135,000 | -- | |
| Joe Alfred K | -- | Alliance Title | |
| Chang Constance E | -- | -- | |
| Chang Constance E | -- | -- |
Source: Public Records
Mortgage History
| Date | Status | Borrower | Loan Amount |
|---|---|---|---|
| Open | Joe Alfred K | $384,000 |
Source: Public Records
Tax History Compared to Growth
Tax History
| Year | Tax Paid | Tax Assessment Tax Assessment Total Assessment is a certain percentage of the fair market value that is determined by local assessors to be the total taxable value of land and additions on the property. | Land | Improvement |
|---|---|---|---|---|
| 2025 | $7,304 | $567,207 | $39,138 | $528,069 |
| 2024 | $7,304 | $556,089 | $38,373 | $517,716 |
| 2023 | $7,187 | $545,190 | $37,623 | $507,567 |
| 2022 | $7,038 | $534,504 | $36,888 | $497,616 |
| 2021 | $6,910 | $524,025 | $36,165 | $487,860 |
| 2020 | $7,056 | $518,655 | $35,796 | $482,859 |
| 2019 | $6,721 | $508,491 | $35,097 | $473,394 |
| 2018 | $6,496 | $498,483 | $34,404 | $464,079 |
| 2017 | $6,121 | $488,712 | $33,732 | $454,980 |
| 2016 | $6,002 | $479,133 | $33,072 | $446,061 |
| 2015 | $5,926 | $471,939 | $32,577 | $439,362 |
| 2014 | $5,772 | $462,699 | $31,941 | $430,758 |
Source: Public Records
Map
Nearby Homes
- 5924 Fulton St
- 3501 Cabrillo St Unit 3503
- 716 35th Ave
- 5600 Fulton St
- 785 39th Ave
- 630 40th Ave
- 4819 Anza St
- 651 41st Ave
- 531 37th Ave
- 531 33rd Ave
- 7039 Geary Blvd
- 845 44th Ave
- 490 33rd Ave Unit 201
- 581 42nd Ave
- 850 45th Ave
- 874 27th Ave
- 882 884 26th Ave
- 745 747 26th Ave
- 7231 7233 Geary Blvd
- 172 174 18th Ave