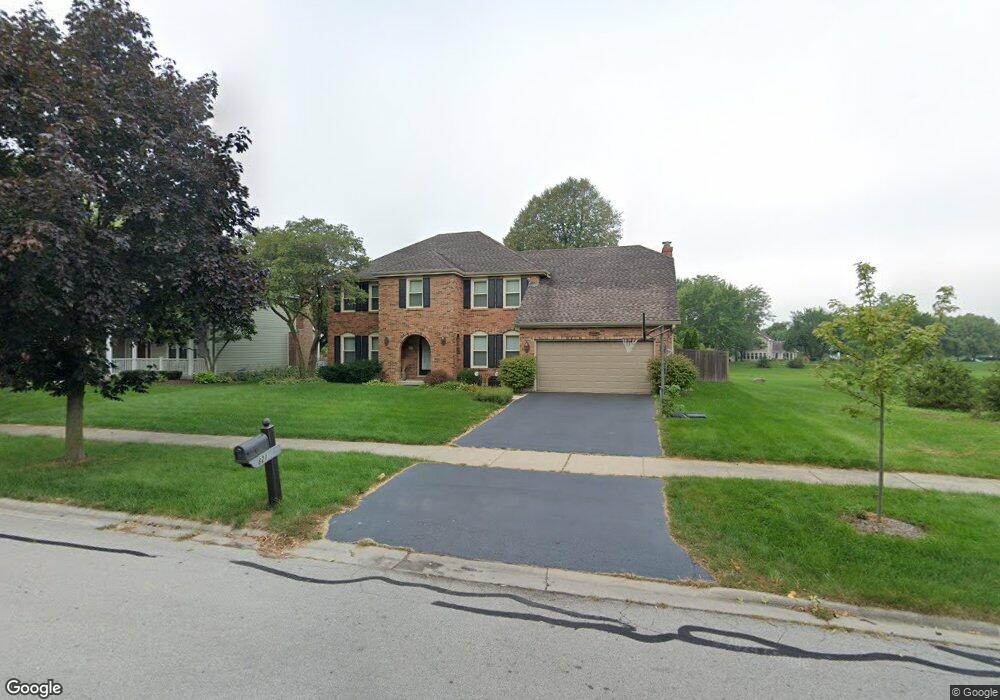
821 Buttonwood Cir Naperville, IL 60540
Watts NeighborhoodEstimated Value: $645,000 - $785,150
4
Beds
3
Baths
3,184
Sq Ft
$229/Sq Ft
Est. Value
About This Home
This home is located at 821 Buttonwood Cir, Naperville, IL 60540 and is currently estimated at $730,538, approximately $229 per square foot. 821 Buttonwood Cir is a home located in DuPage County with nearby schools including May Watts Elementary School, Charlestown Middle School, and Thayer J. Hill Middle School.
Ownership History
Date
Name
Owned For
Owner Type
Purchase Details
Closed on
May 28, 2004
Sold by
Woo Choi Myung Ja and Woo Lee Tae
Bought by
Hernandez David M and Hernandez Kristen M
Current Estimated Value
Home Financials for this Owner
Home Financials are based on the most recent Mortgage that was taken out on this home.
Original Mortgage
$300,000
Outstanding Balance
$151,154
Interest Rate
6.46%
Mortgage Type
Purchase Money Mortgage
Estimated Equity
$579,384
Purchase Details
Closed on
May 15, 2001
Sold by
Hay David W and Hay Lorraine
Bought by
Woo Choi Myung Ja and Woo Lee Tae
Home Financials for this Owner
Home Financials are based on the most recent Mortgage that was taken out on this home.
Original Mortgage
$296,250
Interest Rate
7.07%
Mortgage Type
Stand Alone First
Purchase Details
Closed on
May 30, 2000
Sold by
Landgraf Julianne O and Stuebner Julianne O
Bought by
Hay David W and Hay Lorraine
Home Financials for this Owner
Home Financials are based on the most recent Mortgage that was taken out on this home.
Original Mortgage
$307,363
Interest Rate
8.25%
Create a Home Valuation Report for This Property
The Home Valuation Report is an in-depth analysis detailing your home's value as well as a comparison with similar homes in the area
Home Values in the Area
Average Home Value in this Area
Purchase History
| Date | Buyer | Sale Price | Title Company |
|---|---|---|---|
| Hernandez David M | $393,500 | Pntn | |
| Woo Choi Myung Ja | $353,000 | Mid America Title Company | |
| Hay David W | $334,000 | -- |
Source: Public Records
Mortgage History
| Date | Status | Borrower | Loan Amount |
|---|---|---|---|
| Open | Hernandez David M | $300,000 | |
| Previous Owner | Woo Choi Myung Ja | $296,250 | |
| Previous Owner | Hay David W | $307,363 |
Source: Public Records
Tax History Compared to Growth
Tax History
| Year | Tax Paid | Tax Assessment Tax Assessment Total Assessment is a certain percentage of the fair market value that is determined by local assessors to be the total taxable value of land and additions on the property. | Land | Improvement |
|---|---|---|---|---|
| 2024 | $13,584 | $225,629 | $56,546 | $169,083 |
| 2023 | $13,021 | $202,740 | $50,810 | $151,930 |
| 2022 | $12,751 | $192,580 | $47,870 | $144,710 |
| 2021 | $12,353 | $185,710 | $46,160 | $139,550 |
| 2020 | $12,336 | $185,710 | $46,160 | $139,550 |
| 2019 | $11,855 | $176,630 | $43,900 | $132,730 |
| 2018 | $11,349 | $166,320 | $41,490 | $124,830 |
| 2017 | $11,039 | $160,680 | $40,080 | $120,600 |
| 2016 | $10,841 | $154,200 | $38,460 | $115,740 |
| 2015 | $10,744 | $146,410 | $36,520 | $109,890 |
| 2014 | $10,541 | $138,980 | $34,390 | $104,590 |
| 2013 | $10,518 | $139,950 | $34,630 | $105,320 |
Source: Public Records
Map
Nearby Homes
- 7S410 Arbor Dr
- 1114 Tennyson Ln
- 1262 Rhodes Ln Unit 2701
- 1208 Tennyson Ln
- 1259 Natchez Trace Cir
- 319 Claremont Ct
- 480 Village Green Rd
- 479 River Bend Rd Unit 111
- 1033 Emerald Dr
- 417 River Bluff Cir
- 316 Hemlock Ln
- 845 Tulip Ln
- 225 Elmwood Dr
- 511 Aurora Ave Unit 108
- 132 Robin Hill Dr
- 509 Aurora Ave Unit 209
- 1099 W Jefferson Ave
- 856 Cardiff Rd
- 891 Lowell Ln
- 134 S Whispering Hills Dr
- 825 Buttonwood Cir
- 829 Buttonwood Cir
- 824 Buttonwood Cir
- 1186 Banyon Ct
- 828 Buttonwood Cir
- 833 Buttonwood Cir
- 832 Buttonwood Cir
- 816 S River Rd
- 1174 Banyon Ct
- 820 S River Rd
- 1185 Banyon Ct
- 812 S River Rd
- 808 S River Rd
- 836 Buttonwood Cir
- 837 Buttonwood Cir
- 1166 Banyon Ct
- 824 S River Rd
- 808 Buttonwood Cir
- 1162 Banyon Ct
- 1181 Banyon Ct