Estimated Value: $156,000 - $174,000
3
Beds
2
Baths
1,053
Sq Ft
$158/Sq Ft
Est. Value
About This Home
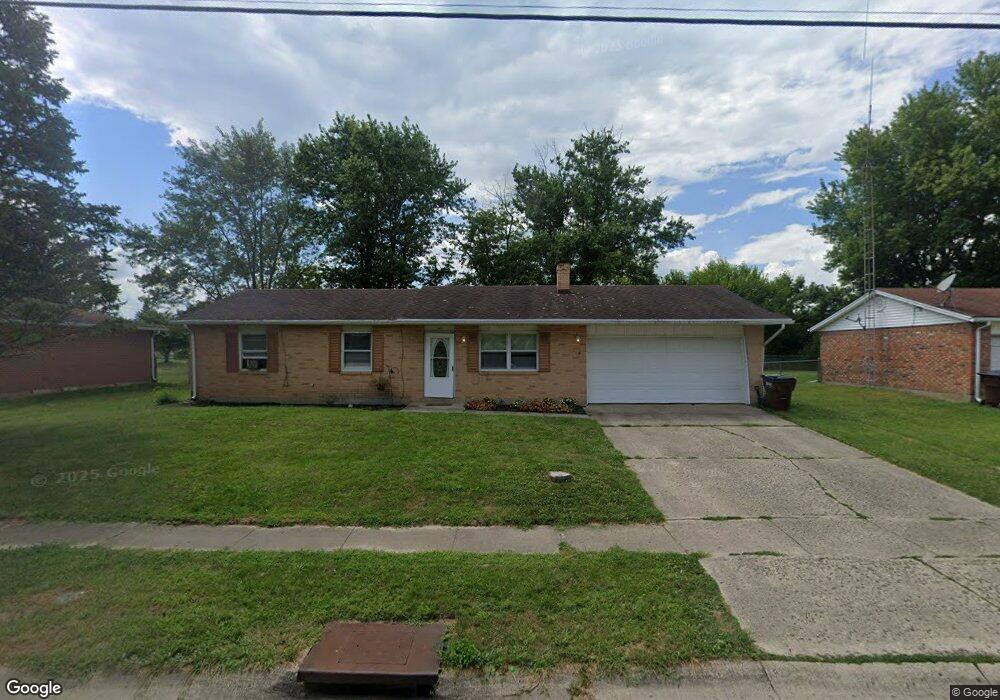
This home is located at 821 S Maple St, Eaton, OH 45320 and is currently estimated at $165,917, approximately $157 per square foot. 821 S Maple St is a home located in Preble County with nearby schools including William Bruce Elementary School, Hollingsworth East Elementary School, and Eaton Middle School.
Ownership History
Date
Name
Owned For
Owner Type
Purchase Details
Closed on
Dec 22, 2014
Sold by
Mccabe Kim L
Bought by
Mccabe Kim L and Kim L Mccabe Living Trust
Current Estimated Value
Purchase Details
Closed on
Aug 8, 2008
Sold by
Mccabe Michael P and Mccabe Kim L
Bought by
Mccabe Kim L and The Living Trust Of Michael P Mccabe
Purchase Details
Closed on
Jan 16, 2008
Sold by
Emc Mortgage Corp
Bought by
Mccabe Kim
Purchase Details
Closed on
Aug 3, 2007
Sold by
Noah Brett
Bought by
Emc Mortgage Corp
Purchase Details
Closed on
May 7, 2004
Sold by
Edwards Wilburn and Edwards Wanda
Bought by
Noah Brett and Noah Lori
Home Financials for this Owner
Home Financials are based on the most recent Mortgage that was taken out on this home.
Original Mortgage
$83,853
Interest Rate
5.85%
Mortgage Type
FHA
Purchase Details
Closed on
Nov 20, 2000
Sold by
Davis Gregg
Bought by
Edwards Wilburn and Edwards Wanda
Create a Home Valuation Report for This Property
The Home Valuation Report is an in-depth analysis detailing your home's value as well as a comparison with similar homes in the area
Home Values in the Area
Average Home Value in this Area
Purchase History
| Date | Buyer | Sale Price | Title Company |
|---|---|---|---|
| Mccabe Kim L | -- | None Available | |
| Mccabe Kim L | -- | Attorney | |
| Mccabe Kim | $62,000 | None Available | |
| Emc Mortgage Corp | $60,000 | None Available | |
| Noah Brett | $77,500 | Republic Title Agency Inc | |
| Edwards Wilburn | $58,000 | -- |
Source: Public Records
Mortgage History
| Date | Status | Borrower | Loan Amount |
|---|---|---|---|
| Previous Owner | Noah Brett | $83,853 |
Source: Public Records
Tax History Compared to Growth
Tax History
| Year | Tax Paid | Tax Assessment Tax Assessment Total Assessment is a certain percentage of the fair market value that is determined by local assessors to be the total taxable value of land and additions on the property. | Land | Improvement |
|---|---|---|---|---|
| 2024 | $1,505 | $41,030 | $5,710 | $35,320 |
| 2023 | $1,505 | $41,030 | $5,710 | $35,320 |
| 2022 | $1,197 | $26,530 | $4,130 | $22,400 |
| 2021 | $1,257 | $26,530 | $4,130 | $22,400 |
| 2020 | $1,211 | $26,530 | $4,130 | $22,400 |
| 2019 | $1,026 | $21,950 | $3,570 | $18,380 |
| 2018 | $1,055 | $21,950 | $3,570 | $18,380 |
| 2017 | $975 | $21,950 | $3,570 | $18,380 |
| 2016 | $895 | $19,820 | $3,470 | $16,350 |
| 2014 | $890 | $19,820 | $3,470 | $16,350 |
| 2013 | $1,027 | $22,470 | $3,465 | $19,005 |
Source: Public Records
Map
Nearby Homes
- 335 Frizzell Ave
- 325 Chestnut Dr
- 813 Cypress Ln
- 3525 South St
- 309 Liberty St
- 219 Nation Ave
- 117 Vine St
- 124 Wynona Dr
- 125 E Decatur St
- 115 E Decatur St
- 233 N Barron St
- 219 E High St
- 0-00 Washington Jackson Rd
- 111 W High St
- 414 N Maple St
- 405 Walnut St
- 124 Deem St
- 612 N Cherry St
- 99 Katherine Dr
- The Heath House Plan at Meadowbrook Estates
- 825 S Maple St
- 817 S Maple St
- 829 S Maple St
- 813 S Maple St
- 824 S Maple St
- 820 S Maple St
- 828 S Maple St
- 816 S Maple St
- 809 S Maple St
- 832 S Maple St
- 812 S Maple St
- 825 Ashtree Dr
- 821 Ashtree Dr
- 829 Ashtree Dr
- 750 S Barron St
- 817 Ashtree Dr
- 836 S Maple St
- 805 S Maple St
- 808 S Maple St
- 833 Ashtree Dr