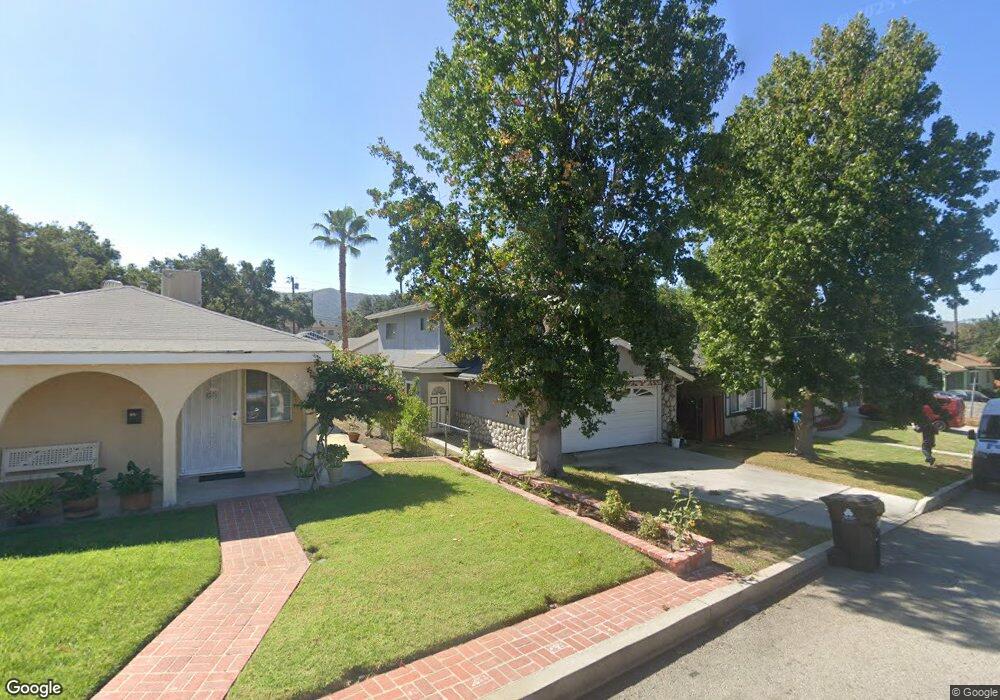
8210 Fenwick St Sunland, CA 91040
Sunland NeighborhoodEstimated Value: $787,669 - $948,000
3
Beds
2
Baths
1,644
Sq Ft
$515/Sq Ft
Est. Value
About This Home
This home is located at 8210 Fenwick St, Sunland, CA 91040 and is currently estimated at $846,167, approximately $514 per square foot. 8210 Fenwick St is a home located in Los Angeles County with nearby schools including Sunland Elementary School, Mt. Gleason Middle School, and Verdugo Hills Senior High School.
Ownership History
Date
Name
Owned For
Owner Type
Purchase Details
Closed on
Feb 5, 2003
Sold by
Truong Dung Vy and Luong Phon M Truong
Bought by
Truong Dung Vy
Current Estimated Value
Home Financials for this Owner
Home Financials are based on the most recent Mortgage that was taken out on this home.
Original Mortgage
$115,000
Interest Rate
5.76%
Purchase Details
Closed on
Feb 24, 1994
Sold by
Truong Hau Vy
Bought by
Truong Dung Vy
Home Financials for this Owner
Home Financials are based on the most recent Mortgage that was taken out on this home.
Original Mortgage
$150,000
Interest Rate
7.09%
Create a Home Valuation Report for This Property
The Home Valuation Report is an in-depth analysis detailing your home's value as well as a comparison with similar homes in the area
Home Values in the Area
Average Home Value in this Area
Purchase History
| Date | Buyer | Sale Price | Title Company |
|---|---|---|---|
| Truong Dung Vy | -- | Commerce Title | |
| Truong Dung Vy | -- | Commerce Title | |
| Truong Dung Vy | -- | Old Republic Title |
Source: Public Records
Mortgage History
| Date | Status | Borrower | Loan Amount |
|---|---|---|---|
| Closed | Truong Dung Vy | $115,000 | |
| Closed | Truong Dung Vy | $150,000 |
Source: Public Records
Tax History
| Year | Tax Paid | Tax Assessment Tax Assessment Total Assessment is a certain percentage of the fair market value that is determined by local assessors to be the total taxable value of land and additions on the property. | Land | Improvement |
|---|---|---|---|---|
| 2025 | $3,859 | $317,724 | $169,496 | $148,228 |
| 2024 | $3,859 | $311,495 | $166,173 | $145,322 |
| 2023 | $3,785 | $305,388 | $162,915 | $142,473 |
| 2022 | $3,608 | $299,401 | $159,721 | $139,680 |
| 2021 | $3,555 | $293,532 | $156,590 | $136,942 |
| 2019 | $3,447 | $284,828 | $151,947 | $132,881 |
| 2018 | $3,411 | $279,244 | $148,968 | $130,276 |
| 2016 | $3,242 | $268,403 | $143,185 | $125,218 |
| 2015 | $3,195 | $264,373 | $141,035 | $123,338 |
| 2014 | $3,210 | $259,195 | $138,273 | $120,922 |
Source: Public Records
Map
Nearby Homes
- 10535 Nassau Ave
- 10610 Oak Tree Way
- 8323 Grenoble St Unit 32
- 8100 Foothill Blvd Unit 1
- 8100 Foothill Blvd Unit 3
- 10412 Eldora Ave
- 8230 Kyle St
- 8444 Grenoble St
- 10338 Oro Vista Ave
- 10353 Oro Vista Ave
- 10323 Eldora Ave
- 10227 Parr Ave
- 10607 Whitegate Ave
- 7851 Fenwick St
- 8048 Wentworth St
- 10531 Greenburn Ave
- 10319 Russett Ave
- 10711 Sherman Grove Ave Unit 36
- 10143 Oro Vista Ave
- 7853 Jayseel St
- 8206 Fenwick St
- 8214 Fenwick St
- 8202 Fenwick St
- 8209 Grenoble St
- 8211 Grenoble St
- 8215 Grenoble St
- 8211 Fenwick St
- 8219 Grenoble St
- 8203 Fenwick St
- 8223 Grenoble St
- 8219 Fenwick St
- 10542 Mcvine Ave
- 8223 Fenwick St
- 10534 Mcvine Ave
- 10559 Mcvine Ave
- 8230 Fenwick St
- 10550 Mcvine Ave
- 8227 Fenwick St
- 10554 Mcvine Ave
- 8229 Grenoble St
Your Personal Tour Guide
Ask me questions while you tour the home.