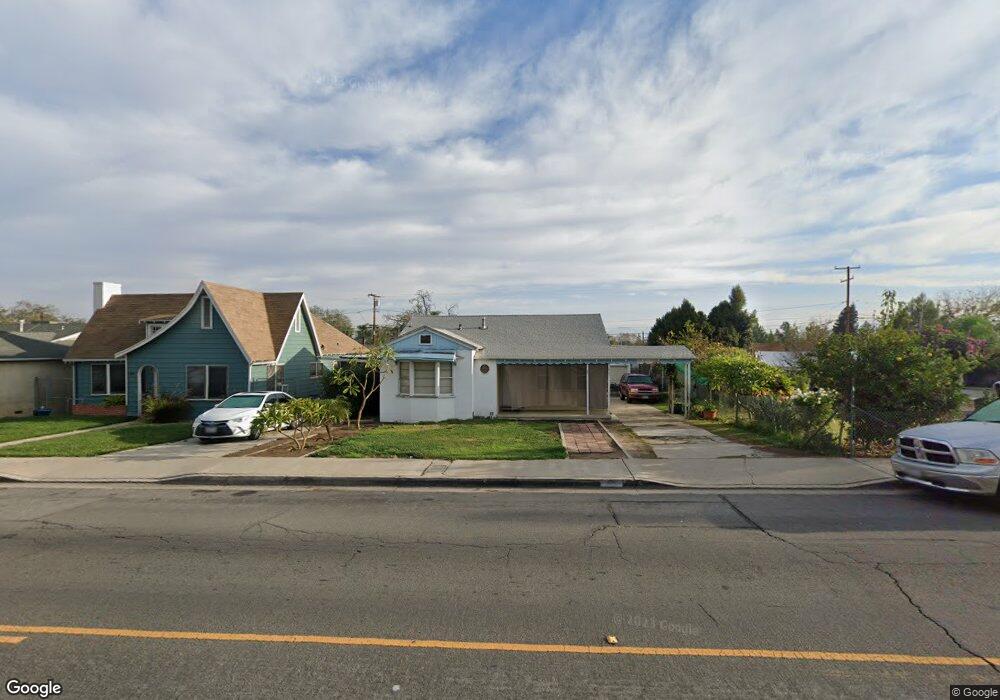
823 Fullerton Ave Corona, CA 92879
Central Corona NeighborhoodEstimated Value: $442,000 - $614,000
2
Beds
1
Bath
885
Sq Ft
$614/Sq Ft
Est. Value
About This Home
This home is located at 823 Fullerton Ave, Corona, CA 92879 and is currently estimated at $543,294, approximately $613 per square foot. 823 Fullerton Ave is a home located in Riverside County with nearby schools including Garretson Elementary School, Auburndale Intermediate, and Centennial High School.
Ownership History
Date
Name
Owned For
Owner Type
Purchase Details
Closed on
Oct 21, 2009
Sold by
Enriquez Daniel
Bought by
Enriquez Daniel and Munoz Enriquez Olivia
Current Estimated Value
Purchase Details
Closed on
Feb 24, 2005
Sold by
Chacon Carlos Jose and Chacon Diane
Bought by
Enriquez Daniel
Home Financials for this Owner
Home Financials are based on the most recent Mortgage that was taken out on this home.
Original Mortgage
$236,000
Outstanding Balance
$114,781
Interest Rate
5%
Mortgage Type
Purchase Money Mortgage
Estimated Equity
$428,513
Purchase Details
Closed on
Nov 12, 2004
Sold by
Campbell David A
Bought by
Chacon Carlos Jose and Chacon Diane
Purchase Details
Closed on
Oct 15, 2002
Sold by
Seager Robert L
Bought by
Campbell David A
Home Financials for this Owner
Home Financials are based on the most recent Mortgage that was taken out on this home.
Original Mortgage
$101,500
Interest Rate
5.86%
Mortgage Type
FHA
Create a Home Valuation Report for This Property
The Home Valuation Report is an in-depth analysis detailing your home's value as well as a comparison with similar homes in the area
Home Values in the Area
Average Home Value in this Area
Purchase History
| Date | Buyer | Sale Price | Title Company |
|---|---|---|---|
| Enriquez Daniel | -- | None Available | |
| Enriquez Daniel | $295,000 | Fnt | |
| Chacon Carlos Jose | $225,000 | First American Title Co | |
| Campbell David A | $125,000 | First American Title Co |
Source: Public Records
Mortgage History
| Date | Status | Borrower | Loan Amount |
|---|---|---|---|
| Open | Enriquez Daniel | $236,000 | |
| Previous Owner | Campbell David A | $101,500 | |
| Closed | Enriquez Daniel | $59,000 |
Source: Public Records
Tax History Compared to Growth
Tax History
| Year | Tax Paid | Tax Assessment Tax Assessment Total Assessment is a certain percentage of the fair market value that is determined by local assessors to be the total taxable value of land and additions on the property. | Land | Improvement |
|---|---|---|---|---|
| 2025 | $4,536 | $411,176 | $132,406 | $278,770 |
| 2023 | $4,536 | $395,211 | $127,265 | $267,946 |
| 2022 | $4,393 | $387,463 | $124,770 | $262,693 |
| 2021 | $4,306 | $379,867 | $122,324 | $257,543 |
| 2020 | $3,901 | $343,856 | $110,334 | $233,522 |
| 2019 | $3,775 | $333,840 | $107,120 | $226,720 |
| 2018 | $3,620 | $321,000 | $103,000 | $218,000 |
| 2017 | $3,447 | $307,000 | $99,000 | $208,000 |
| 2016 | $3,181 | $280,000 | $90,000 | $190,000 |
| 2015 | $3,081 | $273,000 | $88,000 | $185,000 |
| 2014 | $2,734 | $246,000 | $79,000 | $167,000 |
Source: Public Records
Map
Nearby Homes
- 715 Fuller St
- 946 Cedar St
- 778 La Tierra St Unit H103
- 1015 Margarita Dr Unit D202
- 1057 Circle City Dr
- 311 E 8th St
- 402 E Grand Blvd
- 503 E 5th St
- 1031 Ford St
- 1033 E Francis St
- 1063 Quarry St
- 1109 Quarry St
- 210 S Howard St
- 992 Redwood Ct
- 1138 Acacia St
- 0 E 6th St
- 111 N Victoria Ave
- 687 Locust St
- 115 N Victoria Ave
- 1710 Garretson Ave
- 827 Fullerton Ave
- 815 Fullerton Ave
- 810 Cedar St Unit 102
- 810 Cedar St Unit 101
- 915 Park Ln
- 811 Fullerton Ave
- 903 Fullerton Ave
- 818 Fullerton Ave
- 802 Cedar St
- 824 Fullerton Ave
- 800 Cedar St
- 808 Cedar St
- 812 Cedar St
- 812 Cedar St
- 812 Cedar St Unit 102
- 812 Cedar St Unit 101
- 907 Fullerton Ave
- 827 Park Ln
- 925 Park Ln
- 718 Circle City Dr